Fig. 5
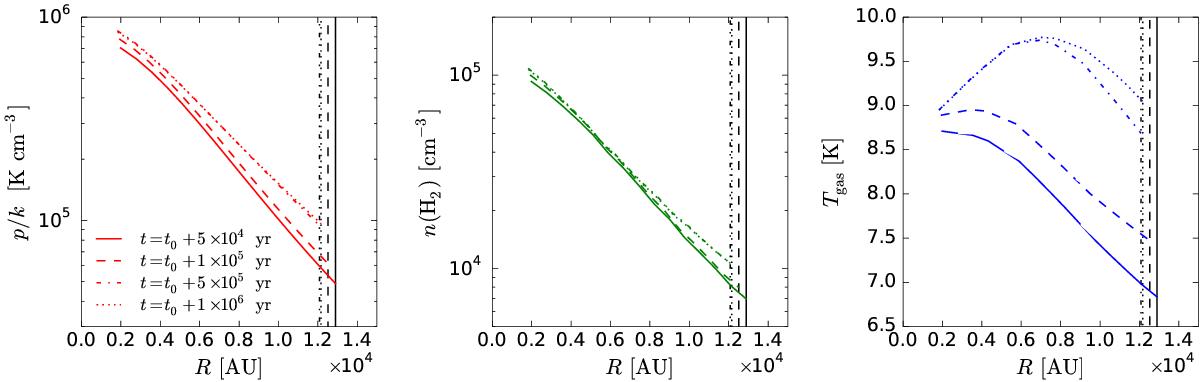
Thermal pressure (left-hand panel), density (middle panel) and gas temperature (right-hand panel) of an M = 1.0 M⊙ MBES with ξout = 6 as functions of distance from the core center at four different time steps, labeled in the left-hand panel. The vertical lines in each panel represent the outer radius of the core at the different time steps.
Current usage metrics show cumulative count of Article Views (full-text article views including HTML views, PDF and ePub downloads, according to the available data) and Abstracts Views on Vision4Press platform.
Data correspond to usage on the plateform after 2015. The current usage metrics is available 48-96 hours after online publication and is updated daily on week days.
Initial download of the metrics may take a while.