Fig. 2
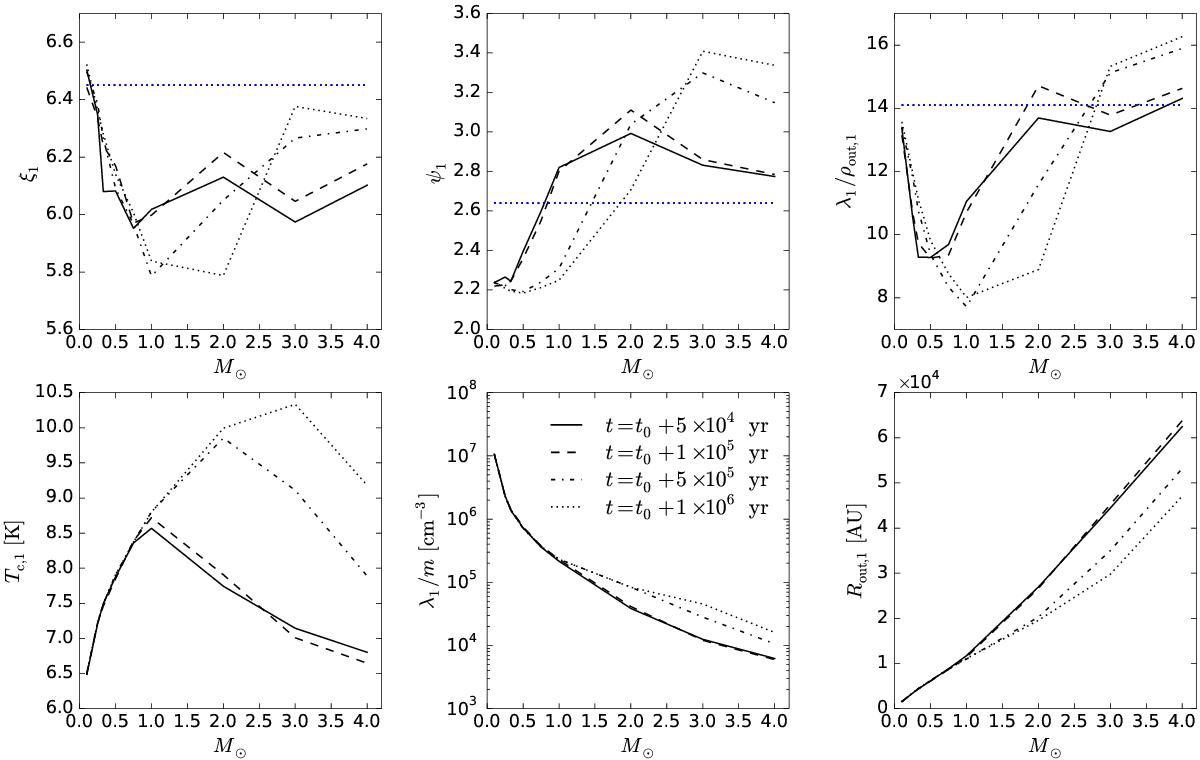
Critical nondimensional radius ξ1 (upper left-hand panel), ψ(ξ1) = ψ1 (upper middle panel), density contrast λ1/ρout,1 = (Tout,1/Tc,1)eψ1 (upper right-hand panel), central temperature Tc,1 = 4πGmβ1/k (lower left), central density λ1/m (lower middle), and the outer core radius Rout,1 = β1/2λ− 1/2ξ1 (lower right) of each critical core configuration as functions of core mass. The profiles are plotted at four different time steps, given in the legend in the bottom middle panel. The blue dotted lines in the upper panels represent the corresponding critical values for the (isothermal) Bonnor-Ebert sphere (ξ0 = 6.45, ψ0 = 2.64, and λ0/ρout,0 = 14.1).
Current usage metrics show cumulative count of Article Views (full-text article views including HTML views, PDF and ePub downloads, according to the available data) and Abstracts Views on Vision4Press platform.
Data correspond to usage on the plateform after 2015. The current usage metrics is available 48-96 hours after online publication and is updated daily on week days.
Initial download of the metrics may take a while.