Fig. 2
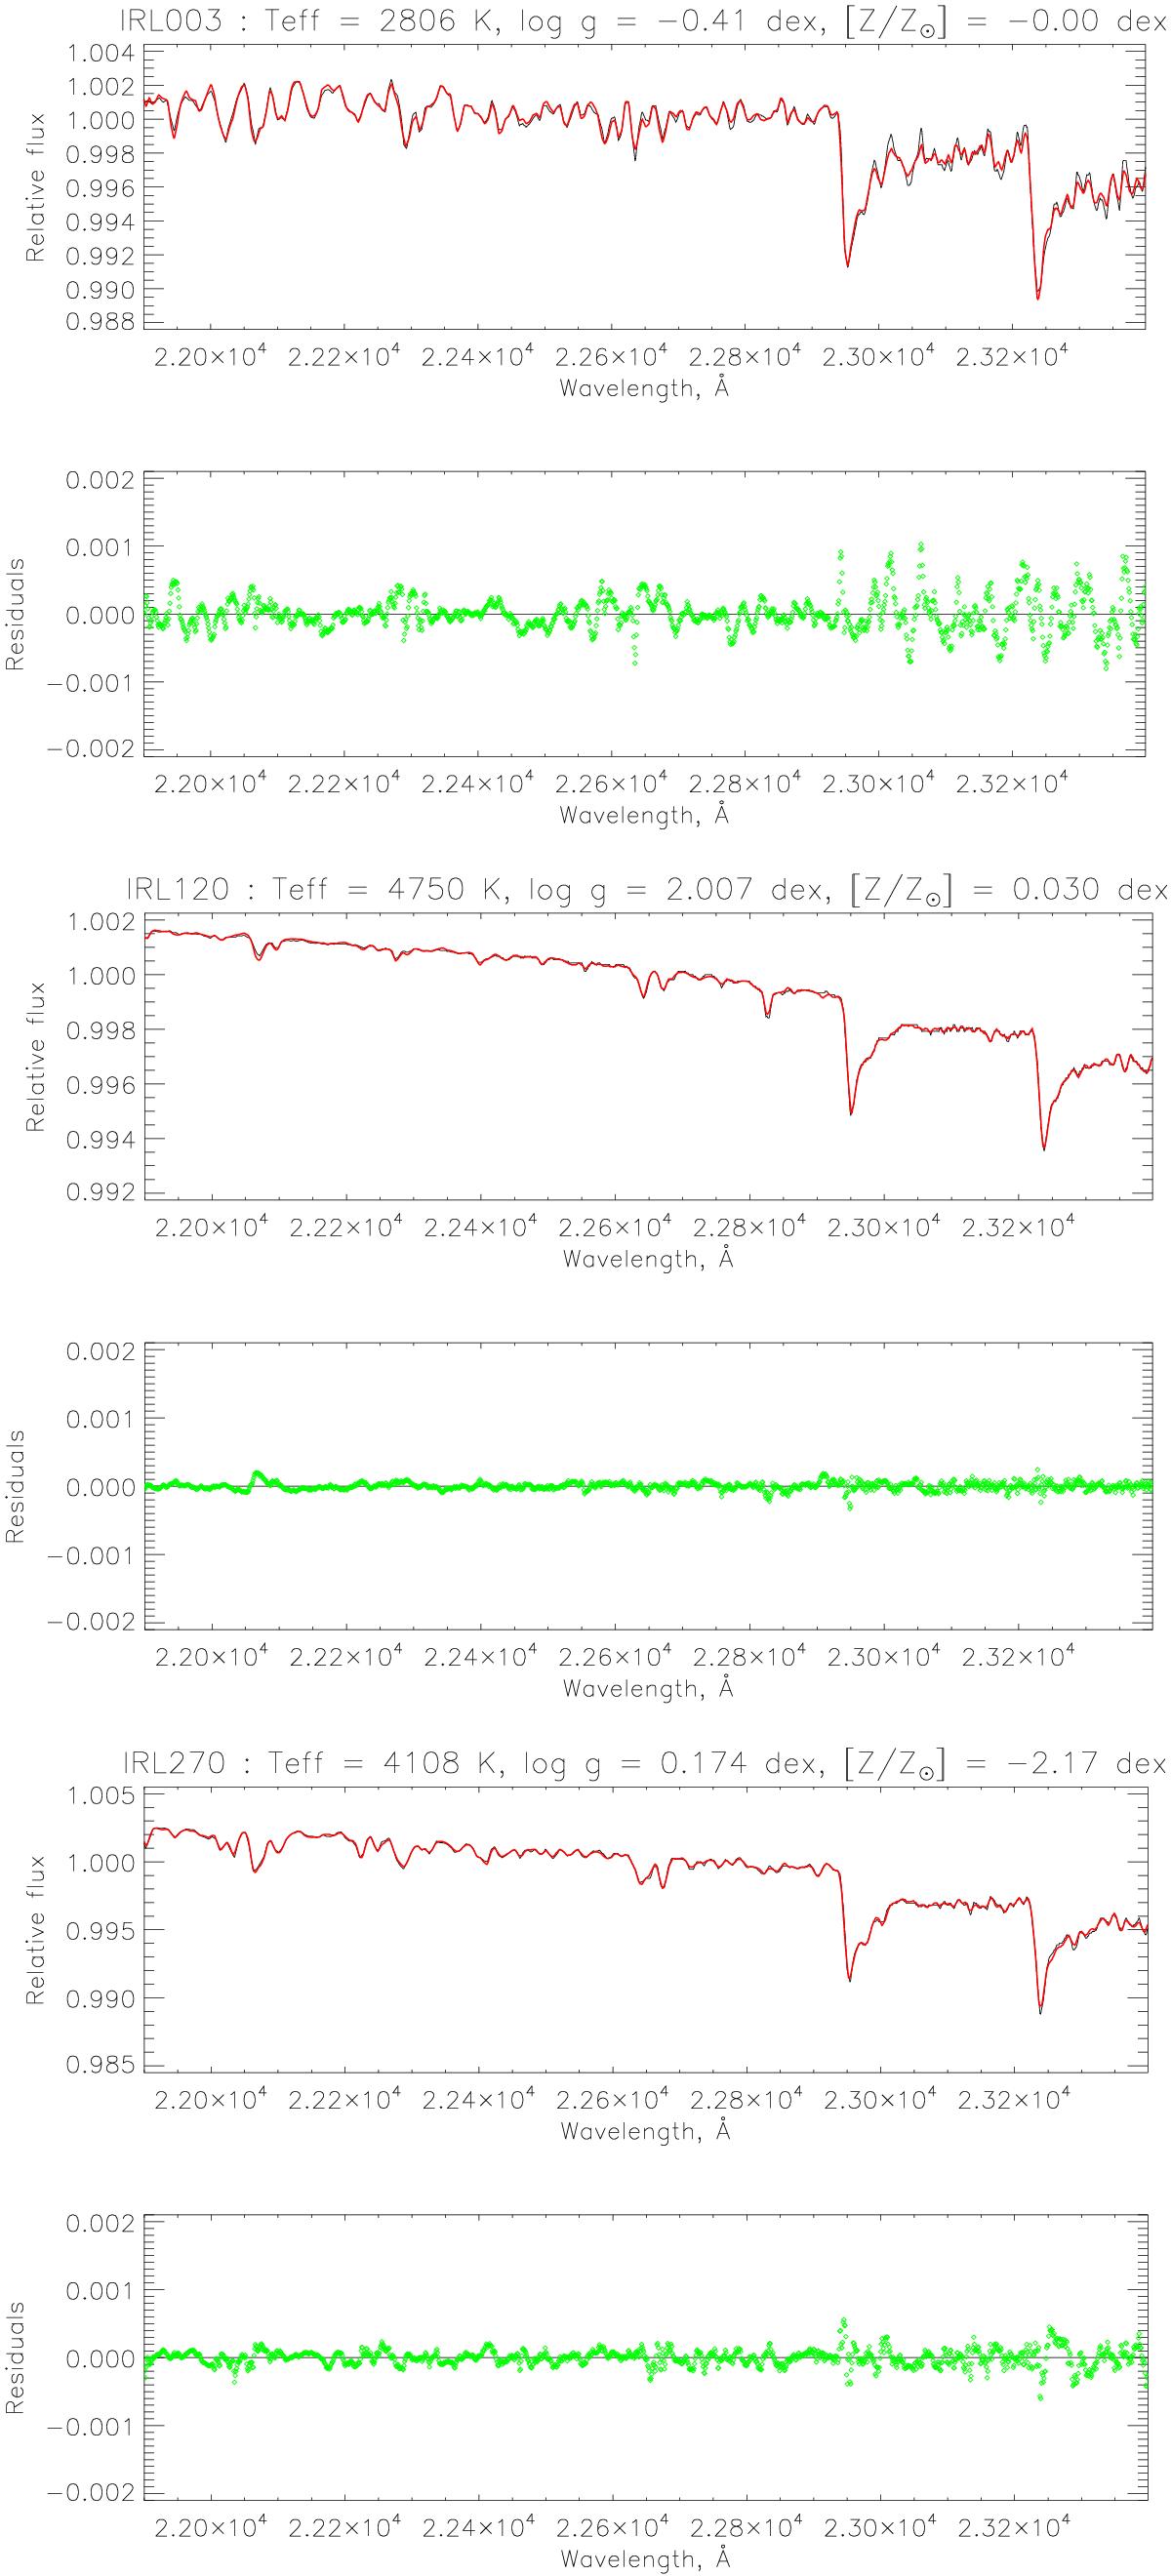
Example of the results obtained with FSF. The name of the stars and the obtained parameters are given in the figure titles. In the upper panels, we show the observed spectrum (black lines) and the best fit model (red lines). In the lower panels, we show the residuals (green data points) which for these stars are less than 0.2%. For details of the fits, see text.
Current usage metrics show cumulative count of Article Views (full-text article views including HTML views, PDF and ePub downloads, according to the available data) and Abstracts Views on Vision4Press platform.
Data correspond to usage on the plateform after 2015. The current usage metrics is available 48-96 hours after online publication and is updated daily on week days.
Initial download of the metrics may take a while.