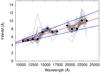
Fig. 19
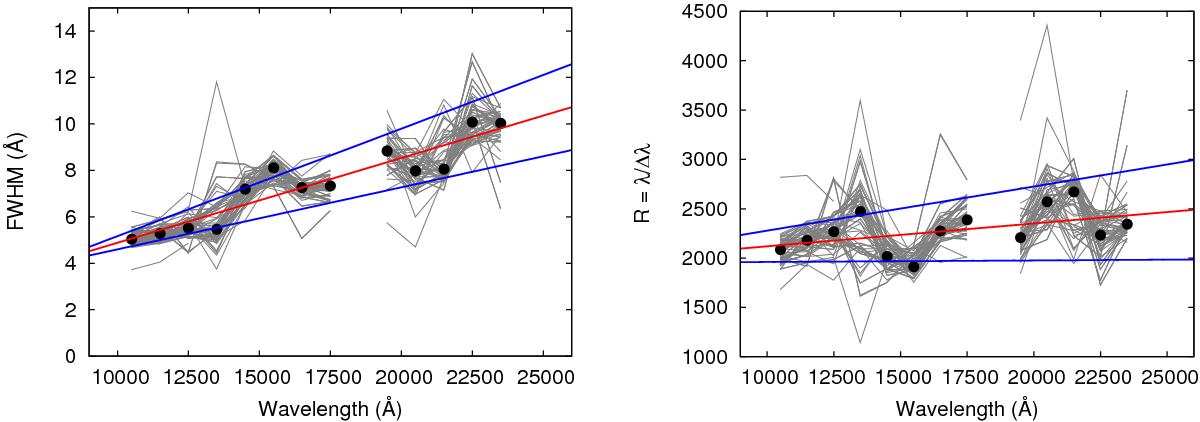
Behaviour of the FWHM (left panel) and the resolving power R (right panel) of the G stars of theIRTF spectral library (grey lines) as a function of wavelength. In both panels, the black points represent the mean values for those effective wavelengths and the blue lines mark the mean dispersion. In the left panel, the red line corresponds to a liner relation of the mean FWHM for each wavelength. In the right panel, the red line is a linear relation of the mean R with effective wavelength.
Current usage metrics show cumulative count of Article Views (full-text article views including HTML views, PDF and ePub downloads, according to the available data) and Abstracts Views on Vision4Press platform.
Data correspond to usage on the plateform after 2015. The current usage metrics is available 48-96 hours after online publication and is updated daily on week days.
Initial download of the metrics may take a while.