Free Access
Fig. 2
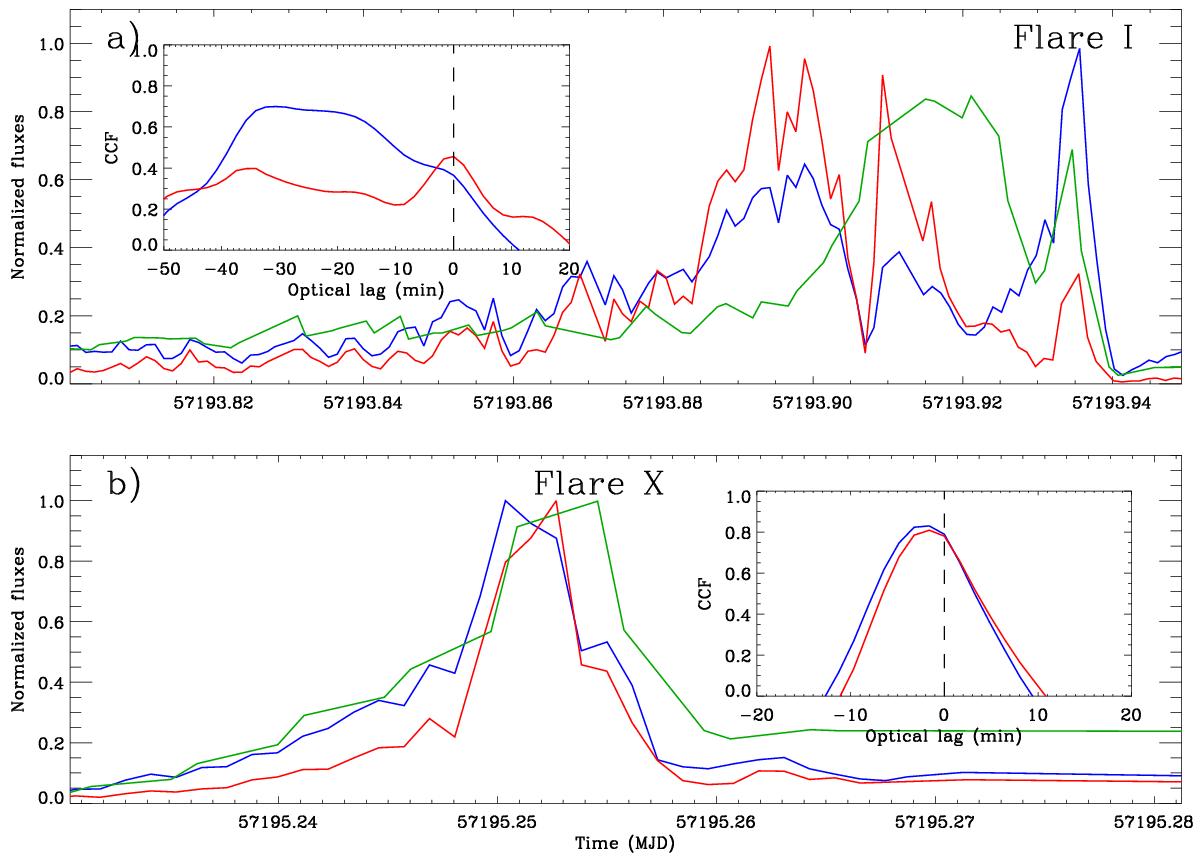
V-band (green), 3–13 keV (red), and 20–40 keV (blue) LCs around flares I a) and X b). The inserts show the cross-correlation functions of the 3–13 keV (red) and 20–40 keV (blue) vs. the optical LCs over the same time intervals as the LCs. The dashed vertical lines represent the 0 lag level.
Current usage metrics show cumulative count of Article Views (full-text article views including HTML views, PDF and ePub downloads, according to the available data) and Abstracts Views on Vision4Press platform.
Data correspond to usage on the plateform after 2015. The current usage metrics is available 48-96 hours after online publication and is updated daily on week days.
Initial download of the metrics may take a while.