Fig. 4
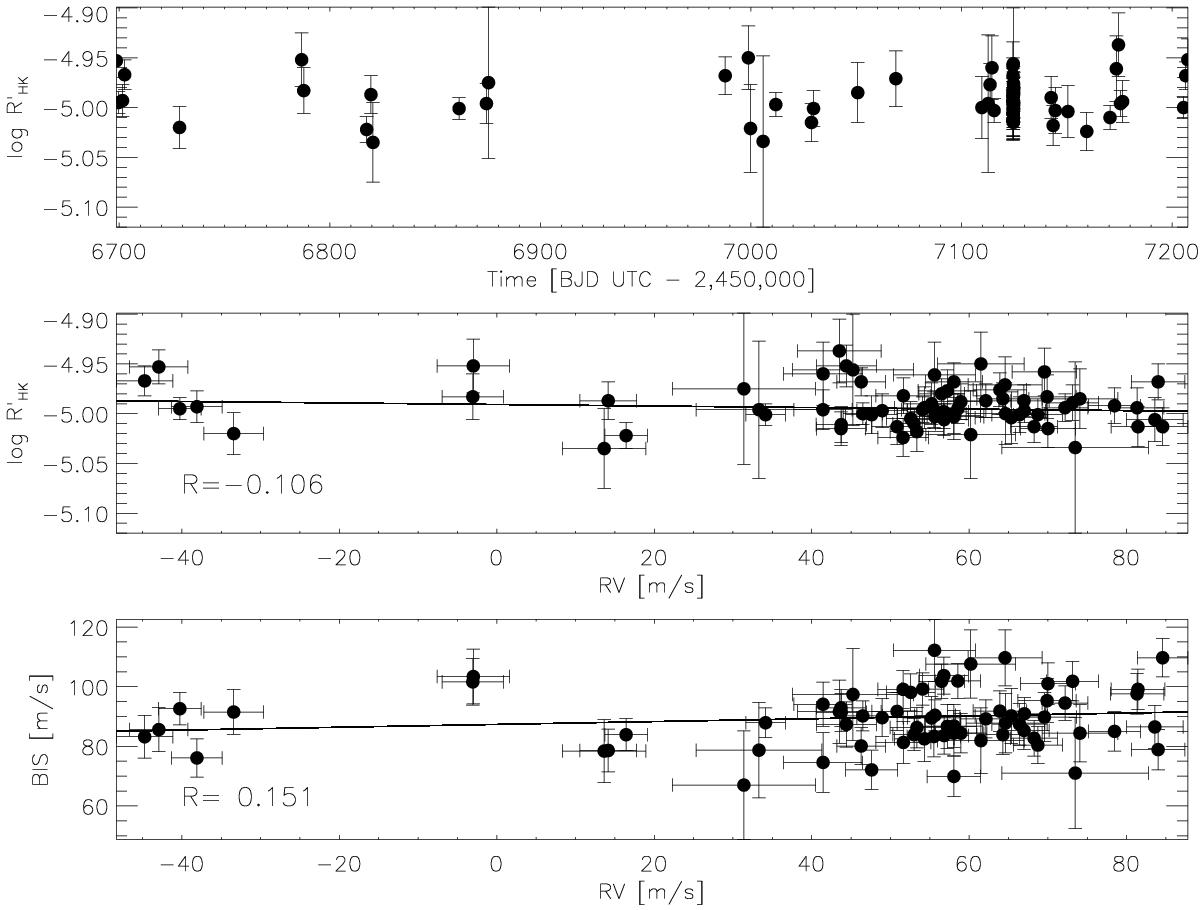
Upper panel: time series of the log(![]() ) chromospheric index as measured from HARPS-N spectra. Middle and lower panels: correlation analysis between the RV residuals, obtained by removing the Keplerian signal due to KELT-6 b from the original HARPS-N dataset, and two indicators of stellar activity derived from the HARPS-N spectra: the log(
) chromospheric index as measured from HARPS-N spectra. Middle and lower panels: correlation analysis between the RV residuals, obtained by removing the Keplerian signal due to KELT-6 b from the original HARPS-N dataset, and two indicators of stellar activity derived from the HARPS-N spectra: the log(![]() ) chromospheric index and the CCF bisector span. Over-plotted are the values of Spearman’s rank correlation coefficients, which show the absence of significant correlations and support the hypothesis that the origin of the observed RV long-term variations is Keplerian.
) chromospheric index and the CCF bisector span. Over-plotted are the values of Spearman’s rank correlation coefficients, which show the absence of significant correlations and support the hypothesis that the origin of the observed RV long-term variations is Keplerian.
Current usage metrics show cumulative count of Article Views (full-text article views including HTML views, PDF and ePub downloads, according to the available data) and Abstracts Views on Vision4Press platform.
Data correspond to usage on the plateform after 2015. The current usage metrics is available 48-96 hours after online publication and is updated daily on week days.
Initial download of the metrics may take a while.