Fig. 2
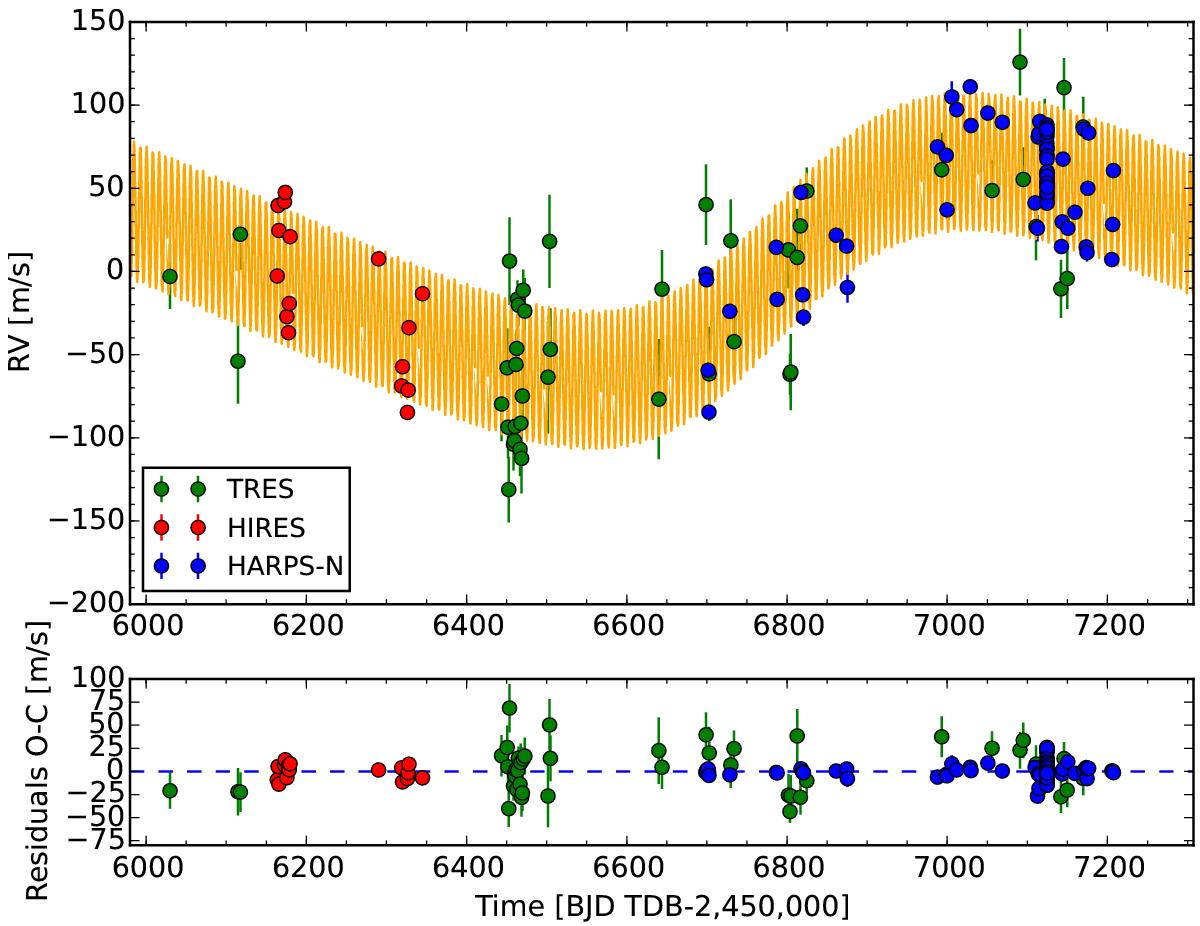
Upper panel: radial velocity time series of KELT-6. The 1σ errorbars are over-plotted to each data point. When they are not visible, this means they are smaller than the symbol size. Over-plotted is our best two-planet Keplerian model (orange line), calculated from the best-fit orbital parameters of Table 4. Lower panel: residuals of the best-fit two-planet model.
Current usage metrics show cumulative count of Article Views (full-text article views including HTML views, PDF and ePub downloads, according to the available data) and Abstracts Views on Vision4Press platform.
Data correspond to usage on the plateform after 2015. The current usage metrics is available 48-96 hours after online publication and is updated daily on week days.
Initial download of the metrics may take a while.