Fig. 1
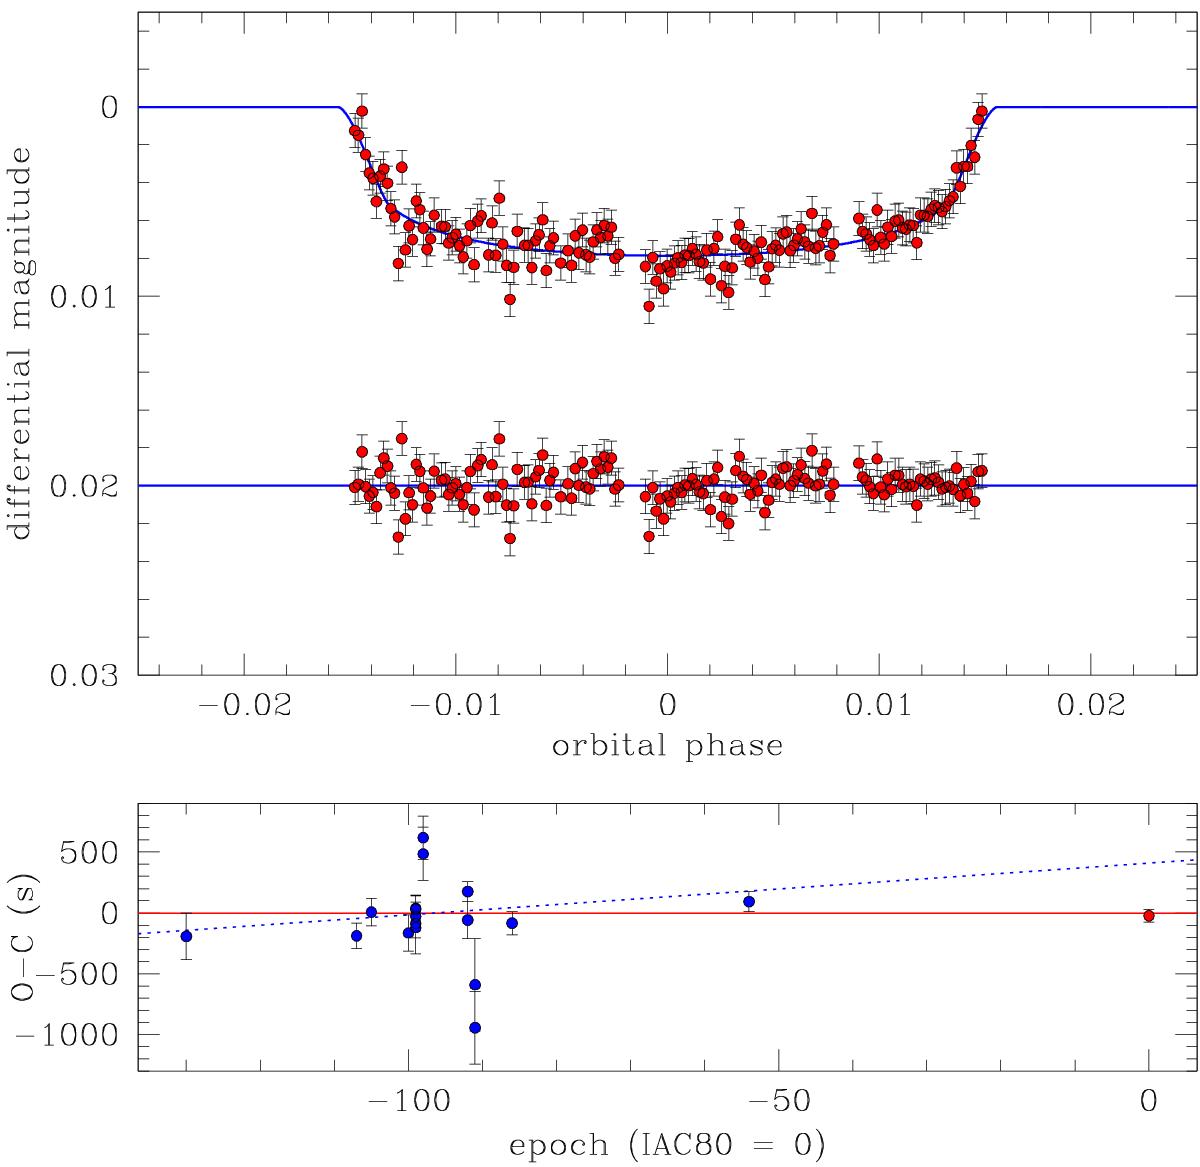
Upper panel: KELT-6 b transit light curve (2014 Apr. 11, IAC-80 telescope), and residuals from the best fit model (which is plotted with a solid blue line). The root mean square of the residuals is 0.9 mmag. Lower panel: O−C diagram including the highest-quality measurements from C014 plus one unpublished measurement from the KELT team (blue points on the left side) and from our IAC-80 observation (red point). The O−C diagram is folded on our newly determined ephemeris (solid red line), while the Co14 ephemeris is plotted with a dotted blue line.
Current usage metrics show cumulative count of Article Views (full-text article views including HTML views, PDF and ePub downloads, according to the available data) and Abstracts Views on Vision4Press platform.
Data correspond to usage on the plateform after 2015. The current usage metrics is available 48-96 hours after online publication and is updated daily on week days.
Initial download of the metrics may take a while.