Free Access
Fig. 6
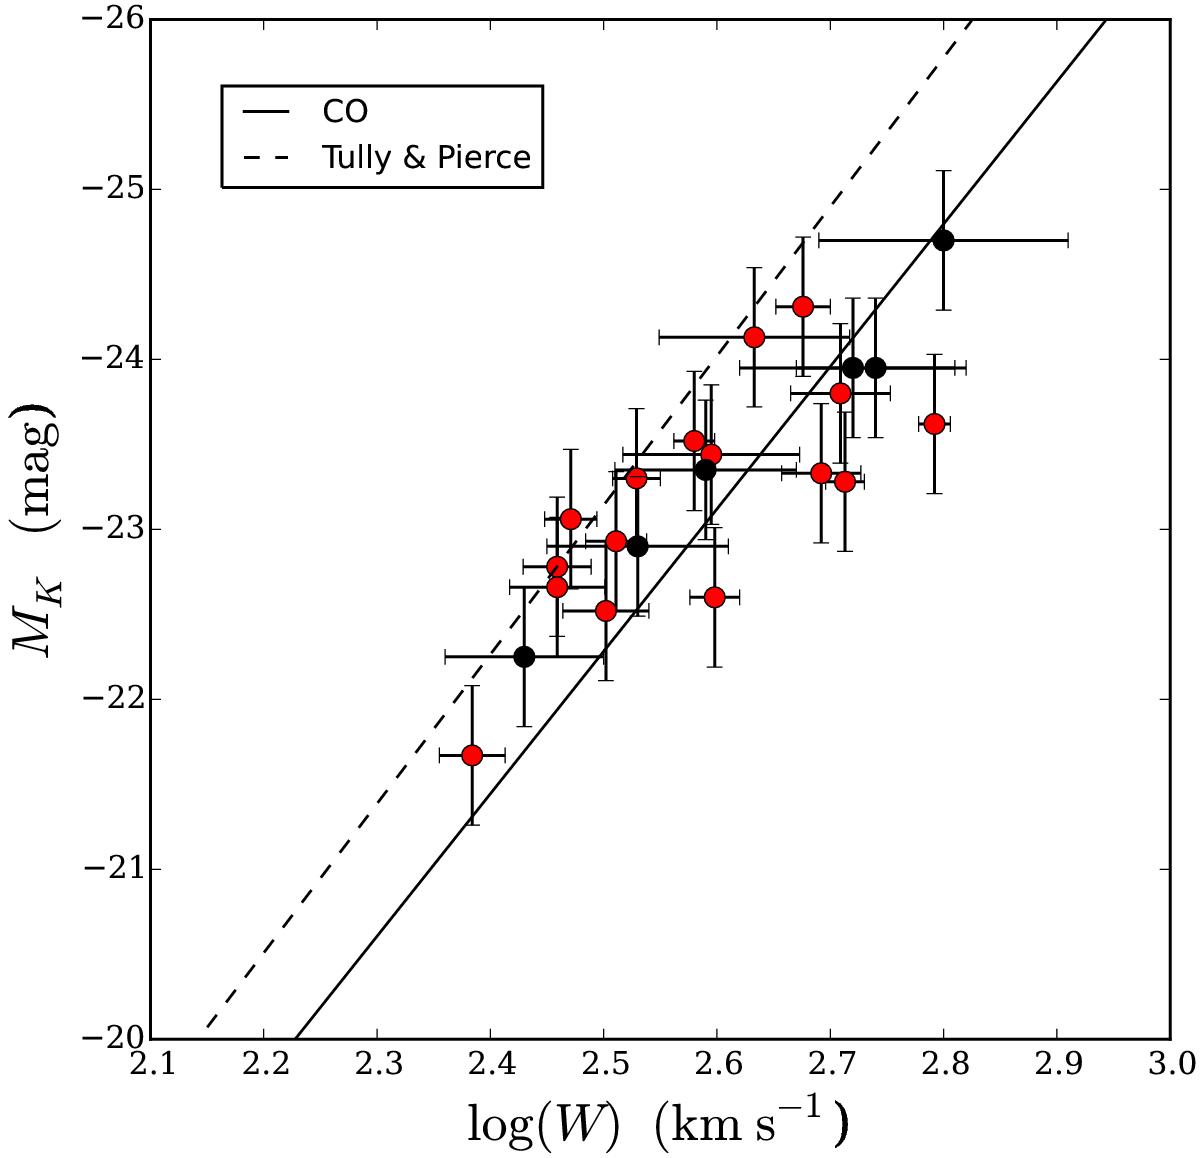
H i Tully-Fisher relation for our 16 galaxies (red circles; W = 2vcirc). The black symbols give the data based on planetary nebulae from Cortesi et al. (2013) for comparison. The CO TFR of Davis et al. (2011) is given by the drawn line. The dashed line gives the Tully & Pierce (2000)K-band TFR for spiral galaxies.
Current usage metrics show cumulative count of Article Views (full-text article views including HTML views, PDF and ePub downloads, according to the available data) and Abstracts Views on Vision4Press platform.
Data correspond to usage on the plateform after 2015. The current usage metrics is available 48-96 hours after online publication and is updated daily on week days.
Initial download of the metrics may take a while.