Fig. 11
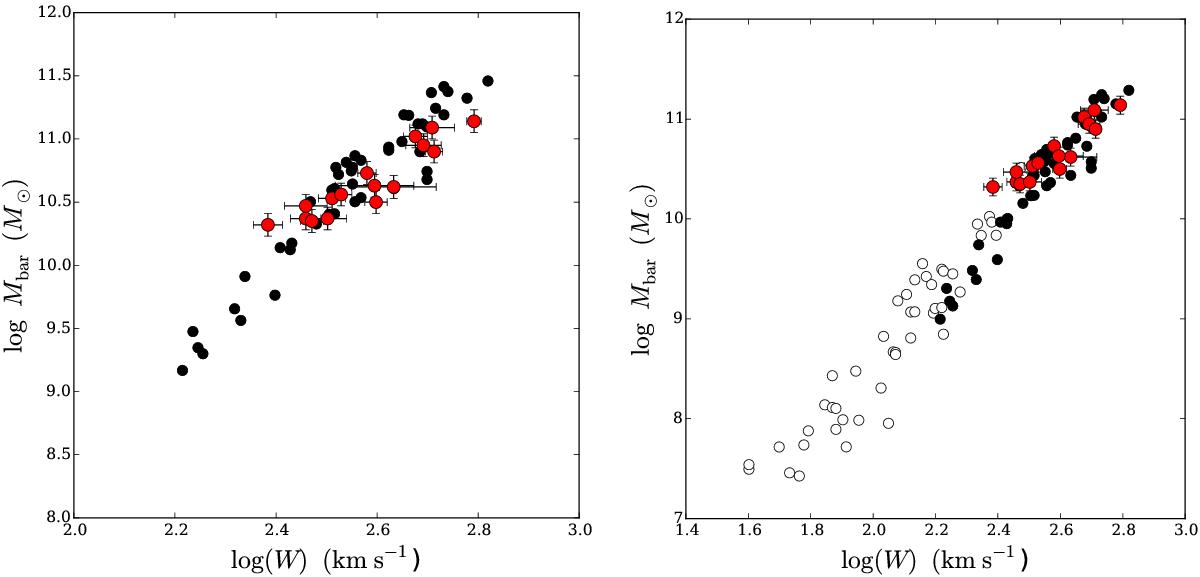
Baryonic TFR where the galaxy masses for our sample galaxies are estimated using M/LJAM. The red symbols represent our ATLAS3D sample, the black symbols are the data from Noordermeer & Verheijen (2007), while the open symbols show the data from McGaugh (2012) for gas-dominated galaxies. For the data from Noordermeer & Verheijen (2007) in the left-hand panel M/LK = 0.8 M⊙/L⊙ was used, as in the original Noordermeer & Verheijen (2007) paper, while in the right-hand panel M/LK = 0.54 M⊙/L⊙ was used. The scaling of the lefthand figure is the same as that of Fig. 7 to facilitate easy comparison.
Current usage metrics show cumulative count of Article Views (full-text article views including HTML views, PDF and ePub downloads, according to the available data) and Abstracts Views on Vision4Press platform.
Data correspond to usage on the plateform after 2015. The current usage metrics is available 48-96 hours after online publication and is updated daily on week days.
Initial download of the metrics may take a while.