Fig. 3
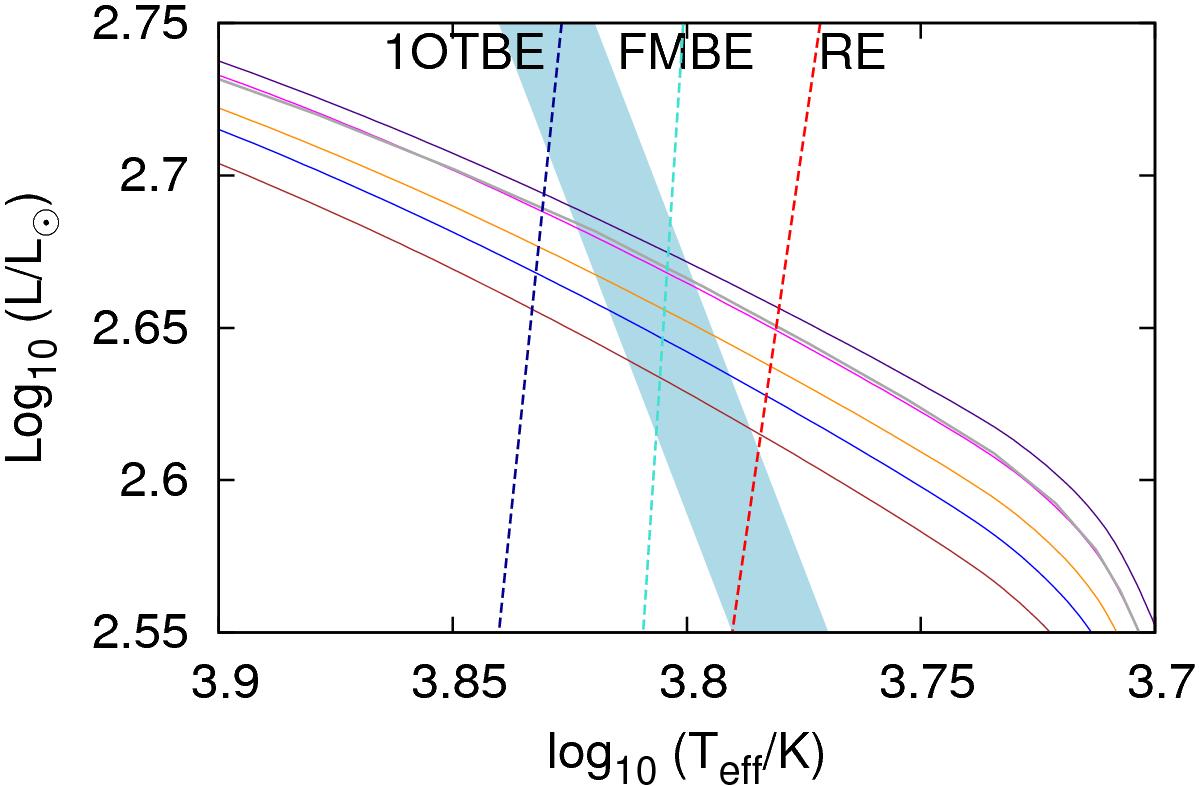
Hertzsprung-Russell diagram showing stellar evolution models evolving across the Hertzsprung gap and the first crossing of the Cepheid instability strip. Solid lines follow evolution models with initial mass M1 = 3.8 M⊙ (gray), along with stellar merger models with progenitor initial masses 2.1 (violet), 2.2 (orange), 2.3 (blue), 2.4 (pink) and 2.5 M⊙ (brown). The blue region represents the measured Cepheid radius while the dashed lines denote the blue edge of the first-overtone instability strip “1OTBE” (dark blue), the boundary between first-overtone and fundamental-mode instability strips “FMBE” (light blue) and the red edge of the Cepheid instability strip “RE” (red) (Bono et al. 2000).
Current usage metrics show cumulative count of Article Views (full-text article views including HTML views, PDF and ePub downloads, according to the available data) and Abstracts Views on Vision4Press platform.
Data correspond to usage on the plateform after 2015. The current usage metrics is available 48-96 hours after online publication and is updated daily on week days.
Initial download of the metrics may take a while.