Press Release
Free Access
Fig. 2
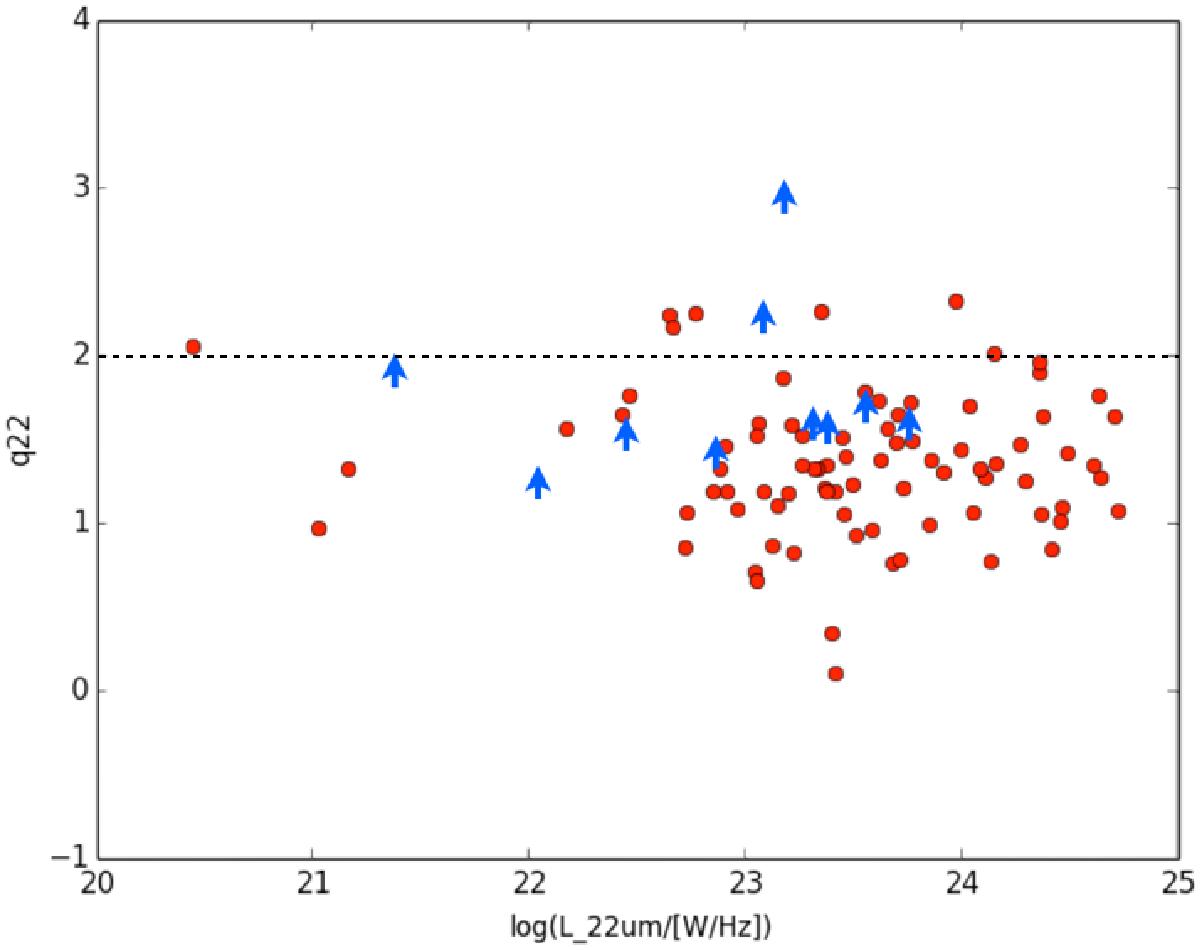
k-corrected values of q22 plotted against the 22 μ mid-IR luminosity (L22 μ, W/Hz) for the Ĝ sample (red filled circles). Above the dashed line, lie the 9 outliers from the sample with q22> 2. Sources not detected in the NVSS radio survey show lower limits for q22, and are presented as arrows.
Current usage metrics show cumulative count of Article Views (full-text article views including HTML views, PDF and ePub downloads, according to the available data) and Abstracts Views on Vision4Press platform.
Data correspond to usage on the plateform after 2015. The current usage metrics is available 48-96 hours after online publication and is updated daily on week days.
Initial download of the metrics may take a while.