Fig. 10
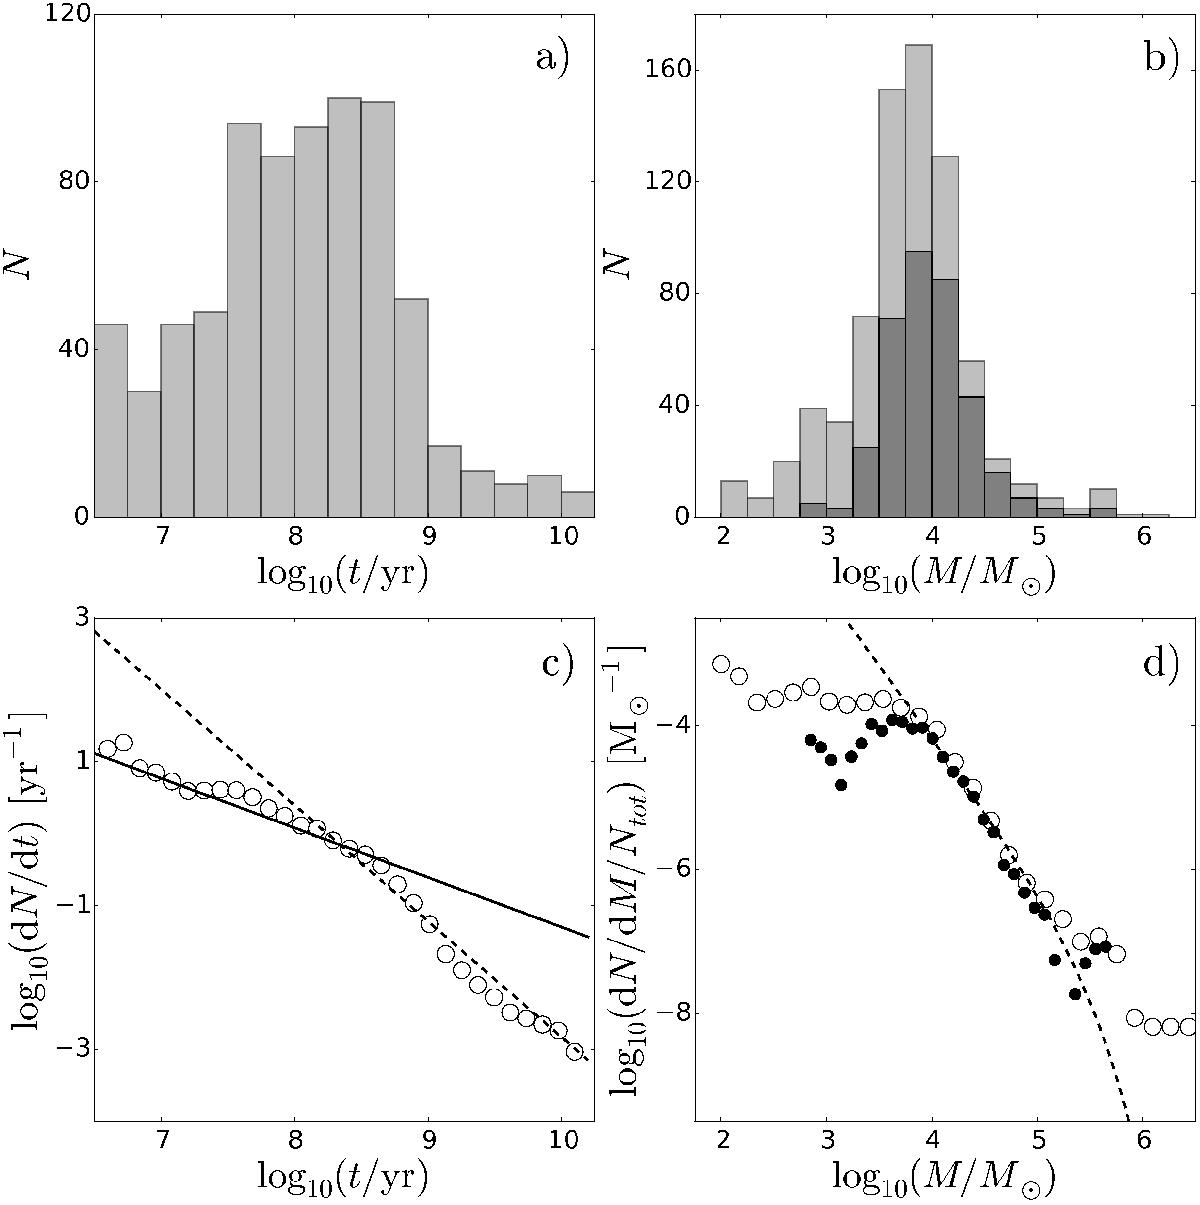
Top row: age (panel a)) and mass (panel b)) distributions derived for the M 33 star cluster sample. Bottom row: differential age (panel c)) and mass (panel d)) distributions. In panel c), the solid line and the dashed line are respectively the cluster evolutionary fading rate and the cluster disruption rate, both taken from the case of M 31 (Vansevičius et al. 2009) and shifted vertically here, for comparison. The dark histogram in panel b) and the black circles in panel d) represent a subsample of clusters with ages between 100 Myr and 3 Gyr. The dashed line in panel d) represents the cluster mass function that follows a Schechter (1976) function with β = 2 and M∗ = 2 × 10⁵M⊙.
Current usage metrics show cumulative count of Article Views (full-text article views including HTML views, PDF and ePub downloads, according to the available data) and Abstracts Views on Vision4Press platform.
Data correspond to usage on the plateform after 2015. The current usage metrics is available 48-96 hours after online publication and is updated daily on week days.
Initial download of the metrics may take a while.