Free Access
Fig. 4
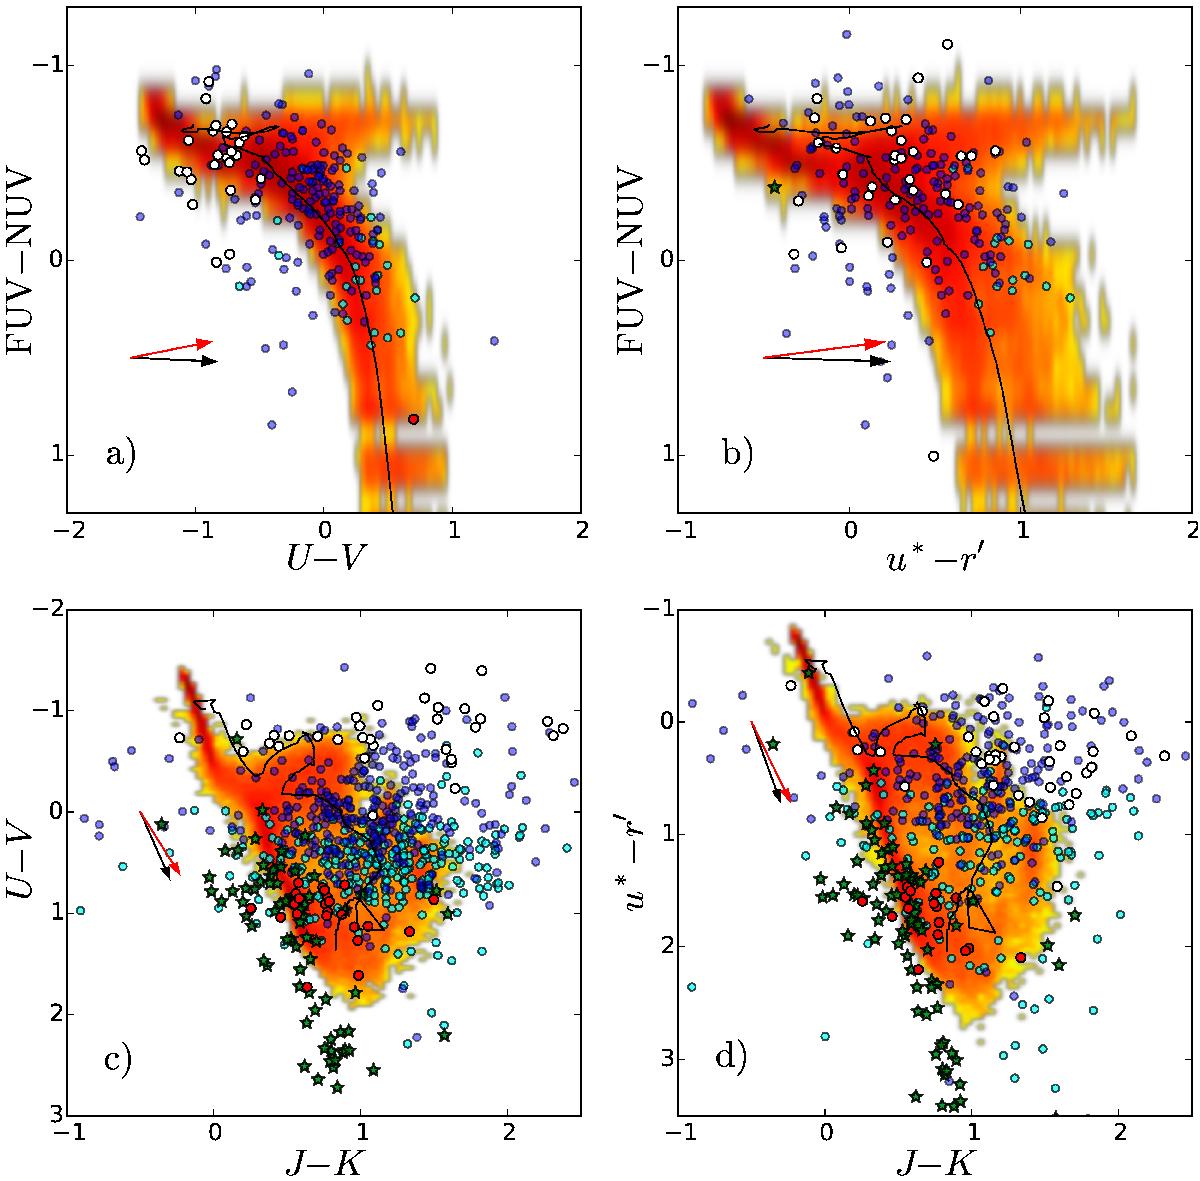
Same as in Fig. 3, but for GALEX-optical colors (top panels) and optical-2MASS colors (bottom panels). In the top panels, a small part of the clusters is shown because most of the clusters are too dim in GALEX passbands, or situated too close to bright neighbor objects.
Current usage metrics show cumulative count of Article Views (full-text article views including HTML views, PDF and ePub downloads, according to the available data) and Abstracts Views on Vision4Press platform.
Data correspond to usage on the plateform after 2015. The current usage metrics is available 48-96 hours after online publication and is updated daily on week days.
Initial download of the metrics may take a while.