Fig. 3
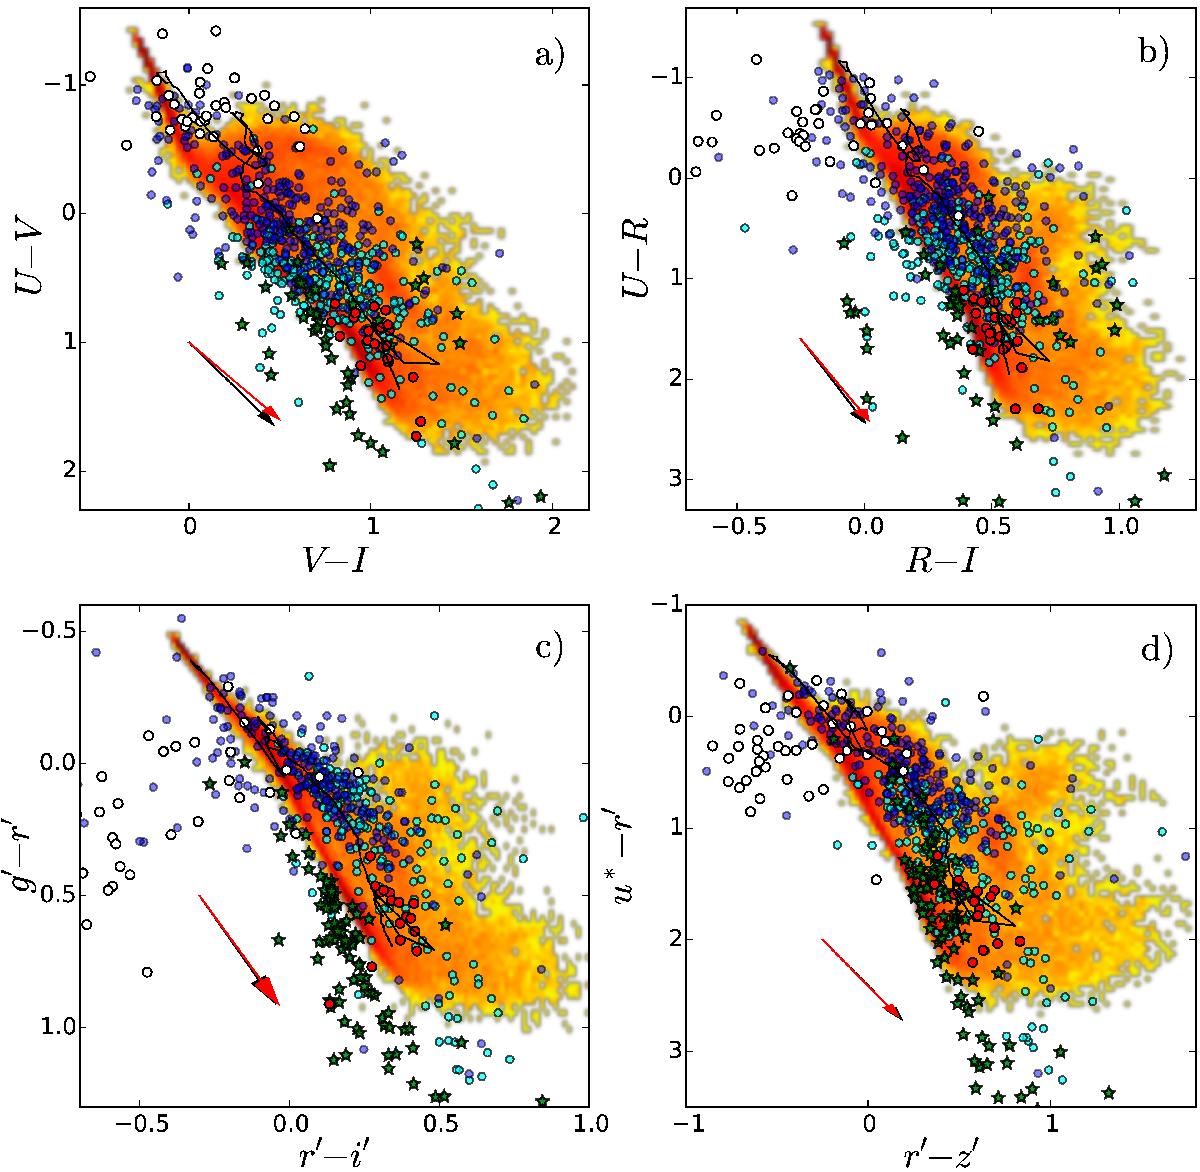
Color–color diagrams of the cluster sample in optical photometric passbands. The first row of panels shows the color–color diagrams in the standard UBVRI photometric system and the second row in the u∗g′r′i′z′ one. In all panels, the blue circles are clusters that are bright in UV, cyan circles are clusters faint in UV, white circles are clusters embedded or close to HII zones, red circles are globular-like clusters, and green stars are likely stars rather than clusters. In each panel, the extent and density of the stochastic star cluster model grid is shown as a density surface (displayed in logarithmic scale), and the solid line is the SSP model for comparison. In both stochastic and SSP models shown here, the metallicity is [ M / H ] = −0.4. The mass of the stochastic cluster models shown here is fixed to log 10(M/M⊙) = 3.5, a typical mass of the low-mass clusters studied in this work, to show the extent of their colors. In each panel, the black arrow shows the Milky Way extinction law direction and the red arrow shows the LMC extinction law direction, both computed for AV = 1 mag.
Current usage metrics show cumulative count of Article Views (full-text article views including HTML views, PDF and ePub downloads, according to the available data) and Abstracts Views on Vision4Press platform.
Data correspond to usage on the plateform after 2015. The current usage metrics is available 48-96 hours after online publication and is updated daily on week days.
Initial download of the metrics may take a while.