Fig. 2
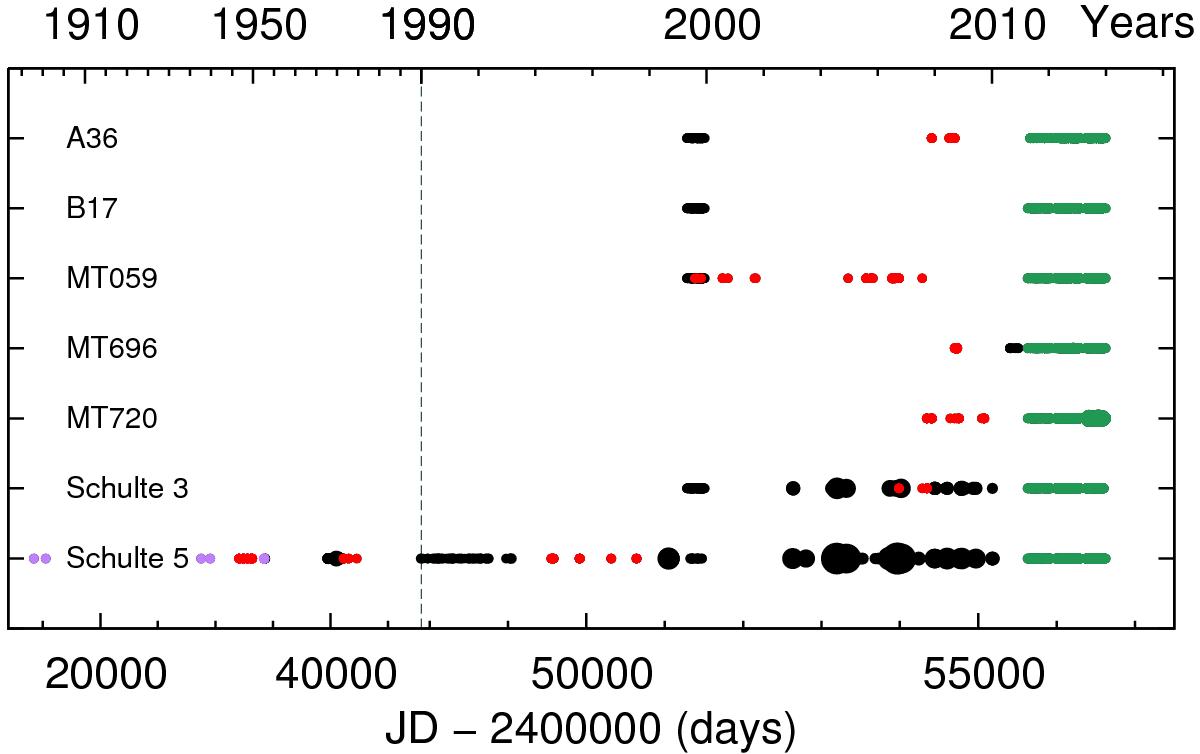
Available data shown in time domain with reduced Julian dates at the bottom and calendar years at the top. Point sizes are indicating the number of measurements in a one-day bin. We have changed the scale of the plot in the middle (dashed line) to better show the data available from 1990 onwards. Green points indicate our photometric data sets, red points are the available RV data, purple points show the times of minimum from Sazonov (1961), and black points are all other available photometric data listed in Table 1.
Current usage metrics show cumulative count of Article Views (full-text article views including HTML views, PDF and ePub downloads, according to the available data) and Abstracts Views on Vision4Press platform.
Data correspond to usage on the plateform after 2015. The current usage metrics is available 48-96 hours after online publication and is updated daily on week days.
Initial download of the metrics may take a while.