Fig. 3
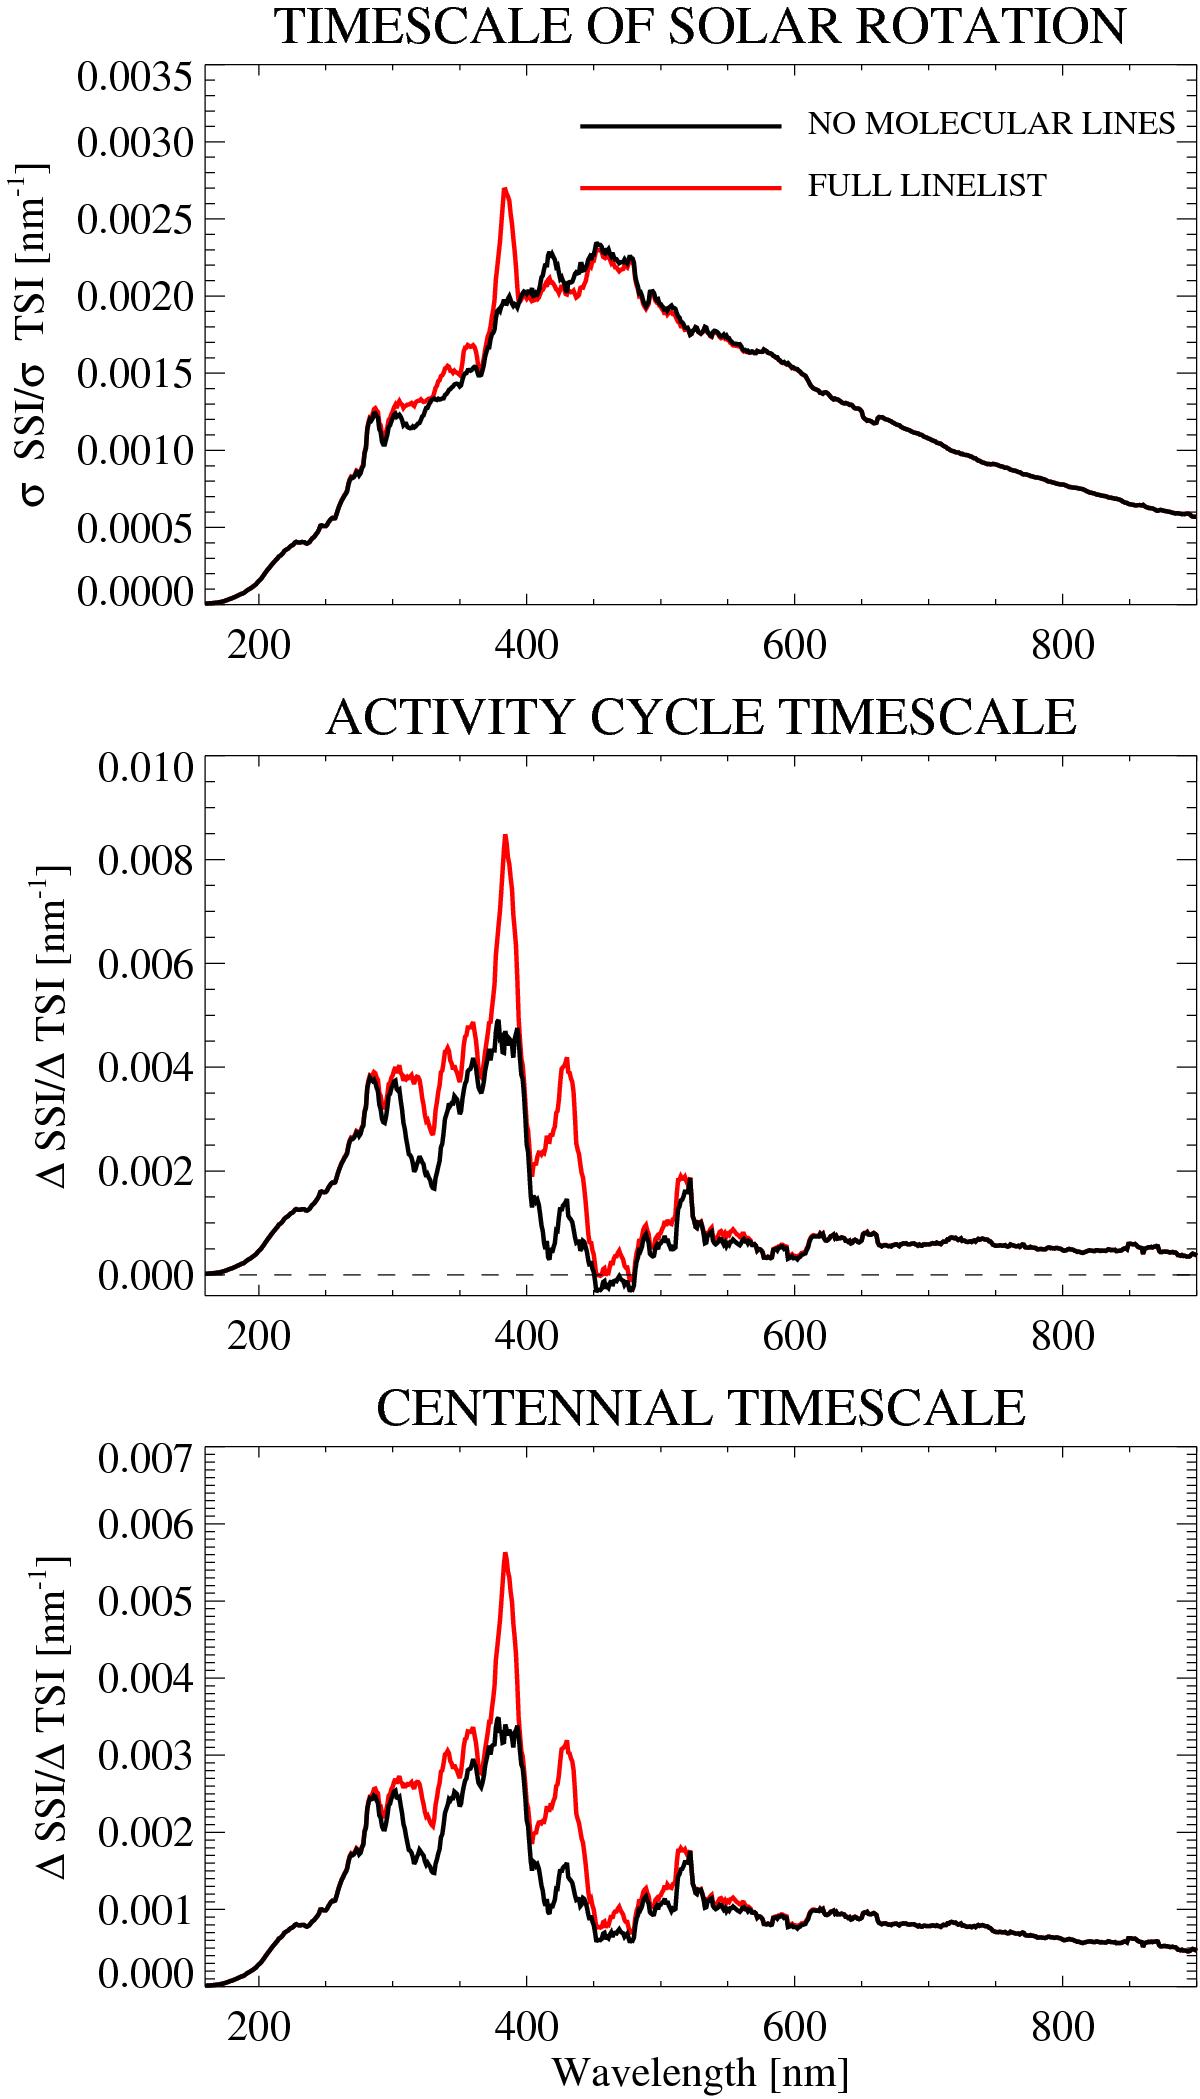
Spectral profiles of the irradiance variability calculated on the solar rotational (upper panel), 11-year activity cycle (middle panel), and centennial (lower panel) timescales. Plotted are the values calculated with “SATIRE-NESSY” model taking the full linelist into account (red curves) as well as putting the opacity in molecular lines to zero (black curves).
Current usage metrics show cumulative count of Article Views (full-text article views including HTML views, PDF and ePub downloads, according to the available data) and Abstracts Views on Vision4Press platform.
Data correspond to usage on the plateform after 2015. The current usage metrics is available 48-96 hours after online publication and is updated daily on week days.
Initial download of the metrics may take a while.