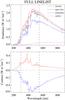
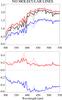
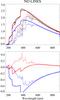
Fig. 1

Upper panels: brightness spectra of the quiet Sun (black curves), faculae (red curves), spot penumbra (blue curves) and umbra (magenta curve, only plotted in the upper left panel). Lower panels: facular (red curves) and penumbral (blue curves) brightness contrasts with respect to the quiet Sun. The dotted curves are calculated taking the spectral lines (full linelist) into account. The solid curves are calculated by putting the opacity in the molecular (middle panels) and in all spectral lines (right panels) to zero. To facilitate the comparison between different spectra and contrasts the dotted curves are plotted in all three panels. The two vertical dotted lines in the left panel constrain the spectral interval shown in the middle panels.
Current usage metrics show cumulative count of Article Views (full-text article views including HTML views, PDF and ePub downloads, according to the available data) and Abstracts Views on Vision4Press platform.
Data correspond to usage on the plateform after 2015. The current usage metrics is available 48-96 hours after online publication and is updated daily on week days.
Initial download of the metrics may take a while.