Free Access
Fig. 6
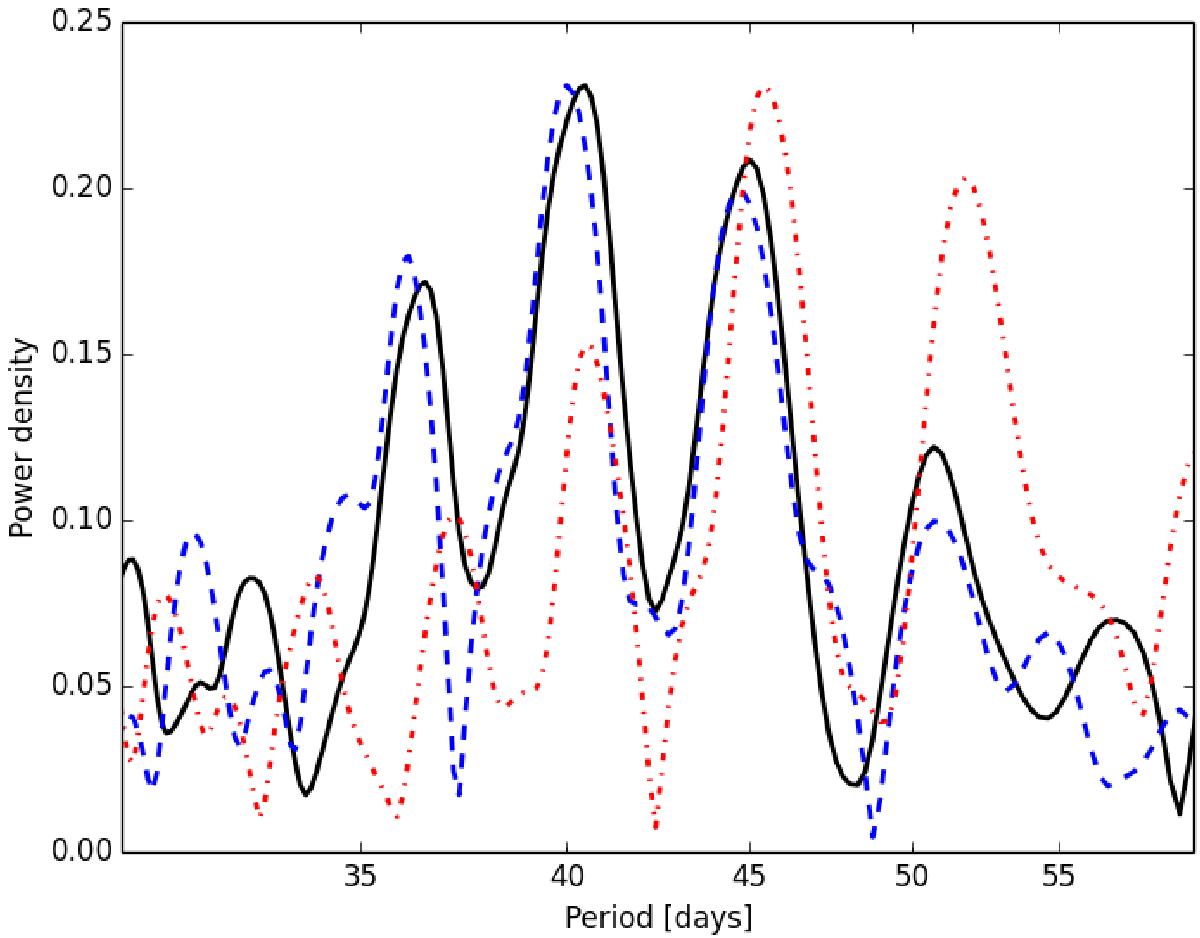
GLS periodogram of the complete HD 164595 RV data (with all the 75 measurements; solid black curve), the 40-day sinusoid (dashed blue curve) and the 45-day sinusoid (dotted and dashed red curve). The 40-day sinusoid clearly is the best match to the RV data.
Current usage metrics show cumulative count of Article Views (full-text article views including HTML views, PDF and ePub downloads, according to the available data) and Abstracts Views on Vision4Press platform.
Data correspond to usage on the plateform after 2015. The current usage metrics is available 48-96 hours after online publication and is updated daily on week days.
Initial download of the metrics may take a while.