Fig. 5
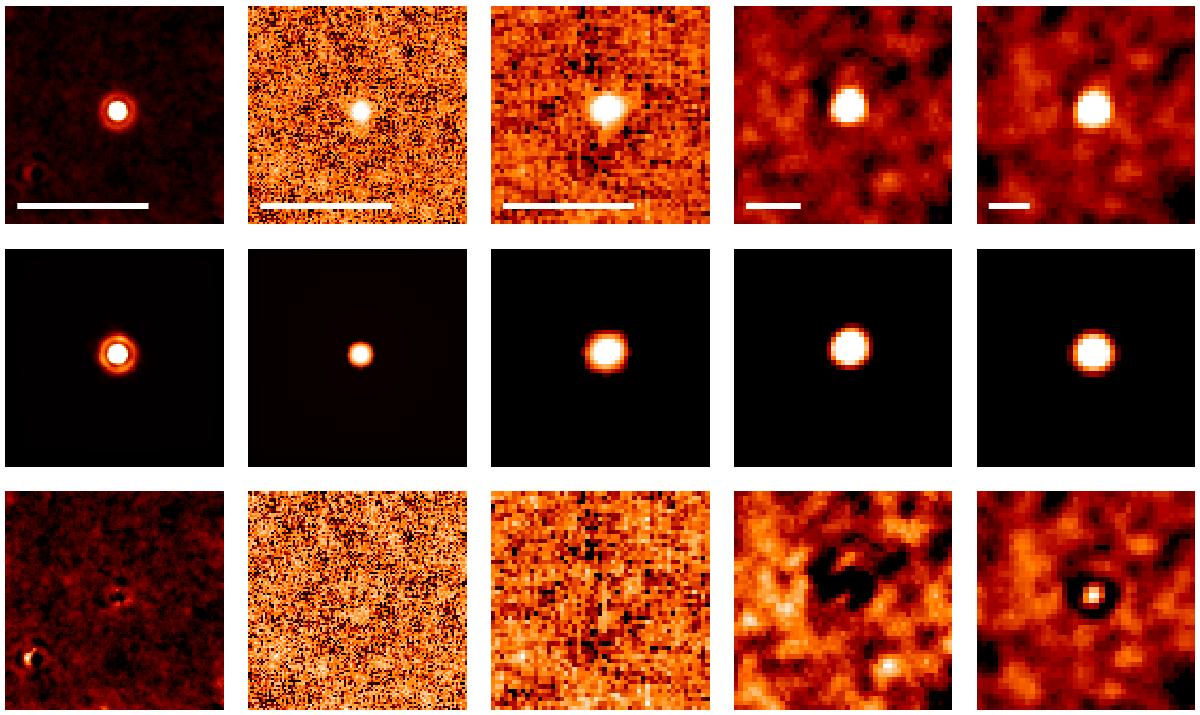
Stacked cutouts (top), best-fit 2D models (middle), and residual images (bottom) from the 24 μm Spitzer/MIPS, 100 and 160 μm Herschel/PACS, 250 and 350 μm Herschel/SPIRE data (left to right; the 500 μm SPIRE image is not shown). The white bar in each top cutout has a length of 30′′. We note that in both the cutouts and model images the flux is dominated by the central point-source.
Current usage metrics show cumulative count of Article Views (full-text article views including HTML views, PDF and ePub downloads, according to the available data) and Abstracts Views on Vision4Press platform.
Data correspond to usage on the plateform after 2015. The current usage metrics is available 48-96 hours after online publication and is updated daily on week days.
Initial download of the metrics may take a while.