Fig. 4
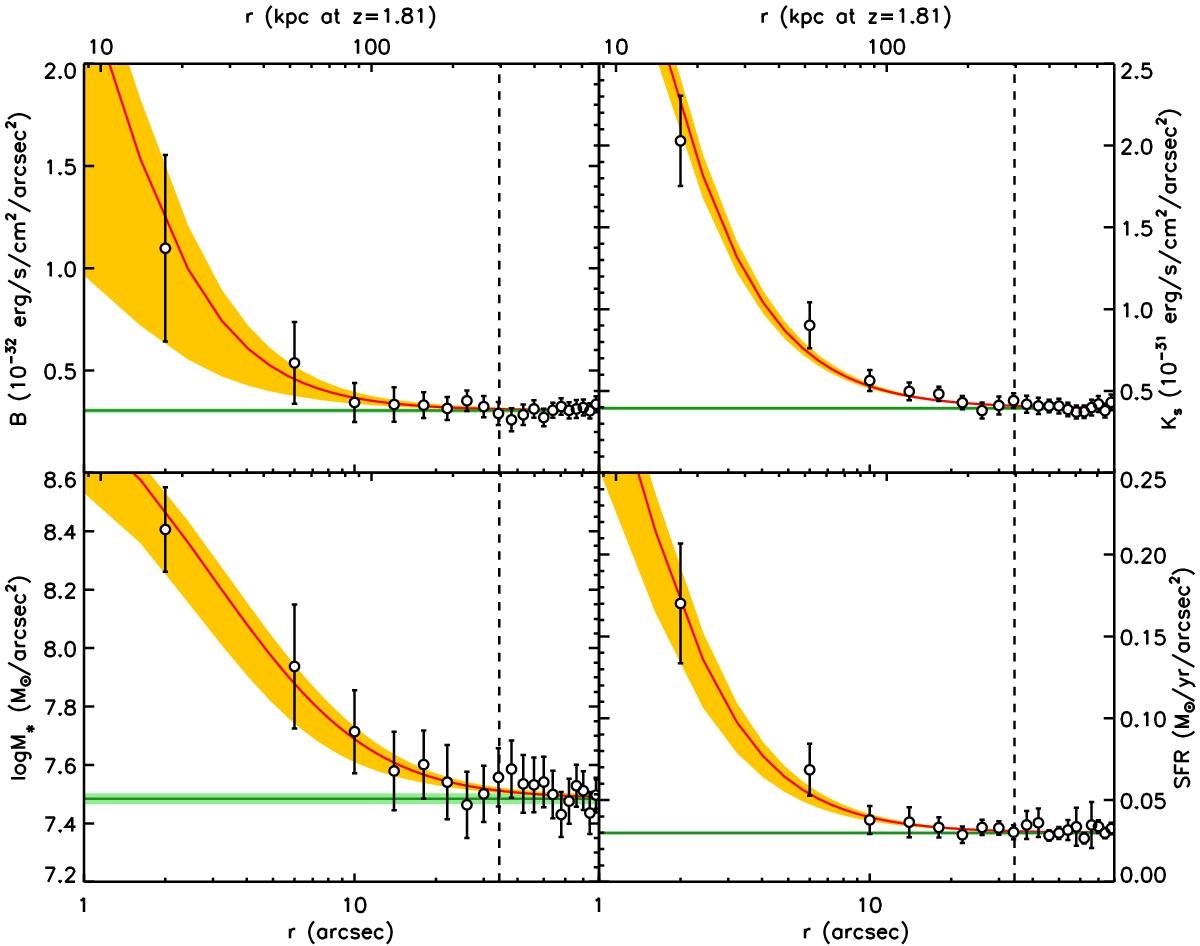
Density profiles of satellites, shown in bins of 4′′ (~35 kpc at z ~ 1.8) for clarity. Clockwise from the top left: B- and Ks-band flux, SFR and stellar mass. The best-fit β-model, shown with its associated uncertainties by the red line and orange envelope, was derived from the unrebinned data. The dashed vertical line marks the average putative virial radius of the halos and the level of contamination by interlopers (i.e., “background”) is shown in green.
Current usage metrics show cumulative count of Article Views (full-text article views including HTML views, PDF and ePub downloads, according to the available data) and Abstracts Views on Vision4Press platform.
Data correspond to usage on the plateform after 2015. The current usage metrics is available 48-96 hours after online publication and is updated daily on week days.
Initial download of the metrics may take a while.