Fig. 10
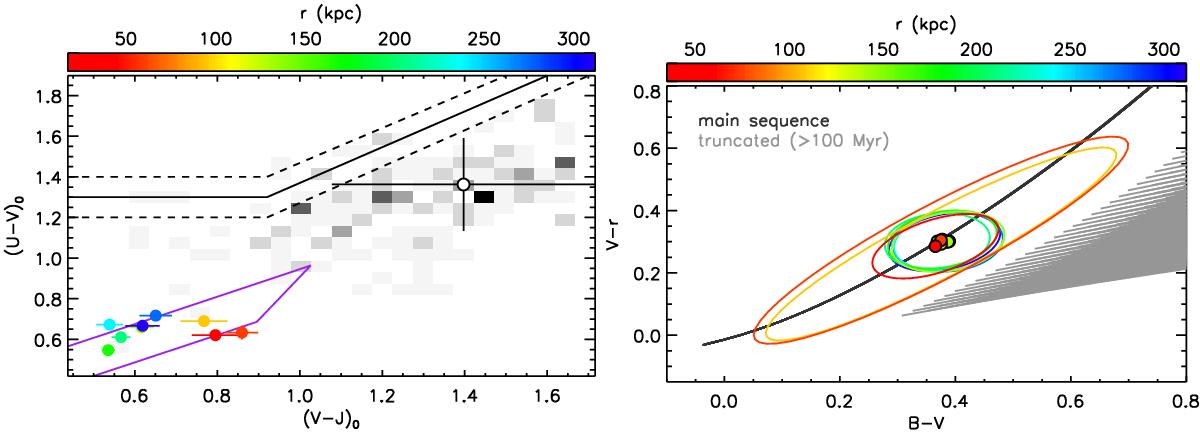
Left: median rest-frame U − V and V − J colors, derived from SED modeling, of star-forming satellites (filled circles, colored as a function of distance to the central) and centrals (open circle and gray density histogram). The purple lines show the expected colors of stellar populations models of varying age following a “main-sequence” SFH, assuming E(B − V) < 0.3. Right: median observed B − V and V − r colors of satellites, as a function of distance to the central, compared to the expected colors of a star-forming model (main-sequence SFH, black) and a constant SFR one observed ≥100 Myr after the quenching of star formation (gray). We here include dust extinction with E(B − V) = 0–2. The ellipses show the dispersion of B − V and V − r values in each radial bin.
Current usage metrics show cumulative count of Article Views (full-text article views including HTML views, PDF and ePub downloads, according to the available data) and Abstracts Views on Vision4Press platform.
Data correspond to usage on the plateform after 2015. The current usage metrics is available 48-96 hours after online publication and is updated daily on week days.
Initial download of the metrics may take a while.