Fig. 1
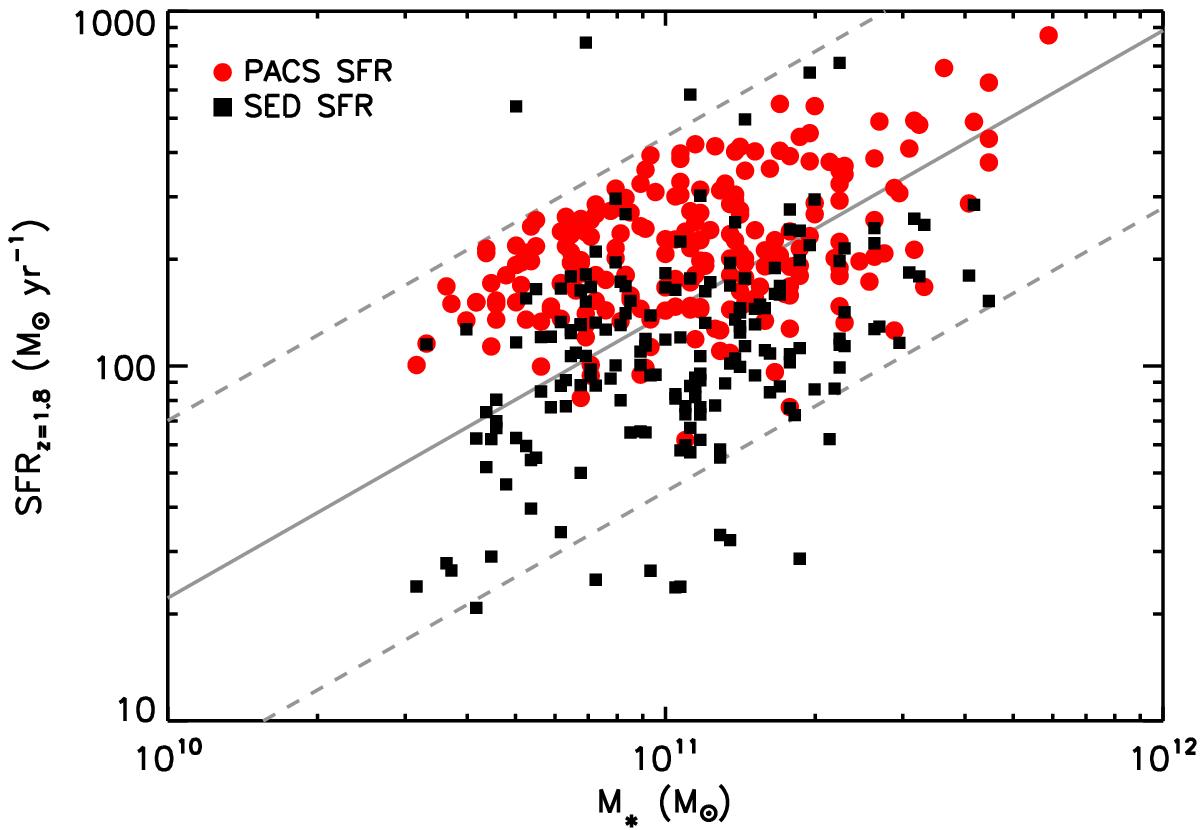
SFR of centrals as a function of their stellar mass, for SFR estimates from, respectively, Herschel/PACS fluxes (red circles) and SED modeling (black squares). Our adopted parametrization of the main sequence at z = 1.8 is shown as a gray line, with the 0.5 dex limit shown by dashed lines. The SFRs shown here have been corrected according to the difference in normalization between the main sequence at z = 1.8 and the redshift of the objects.
Current usage metrics show cumulative count of Article Views (full-text article views including HTML views, PDF and ePub downloads, according to the available data) and Abstracts Views on Vision4Press platform.
Data correspond to usage on the plateform after 2015. The current usage metrics is available 48-96 hours after online publication and is updated daily on week days.
Initial download of the metrics may take a while.