Fig. 5
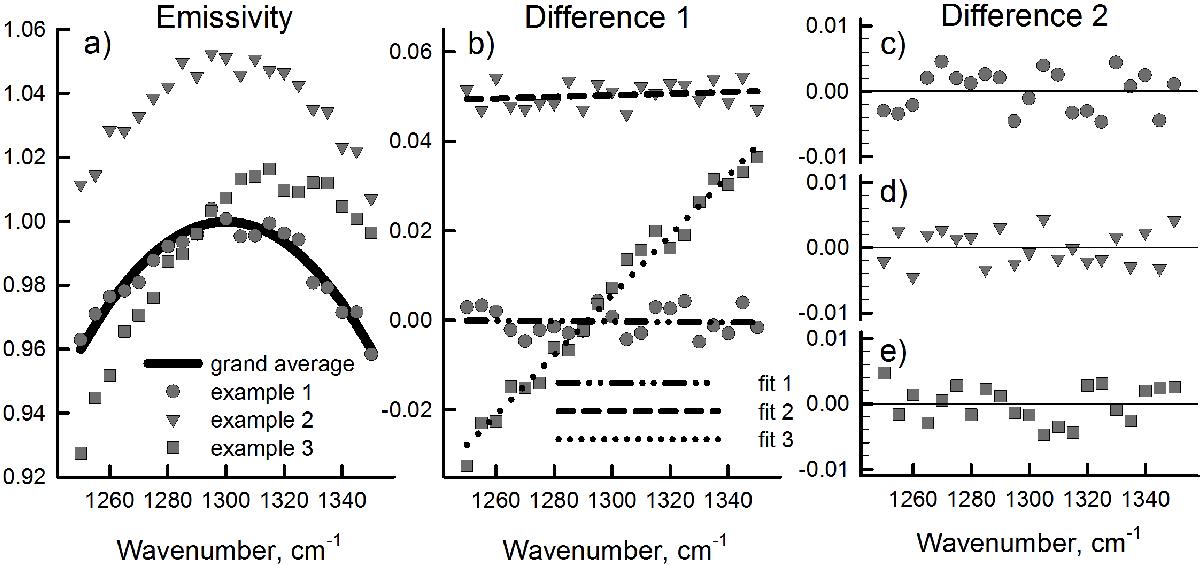
Cartoon illustrating how the noise parameter is defined. a) Three notional noisy spectra are shown together with the notional grand average of all the entire hypothetical dataset, assumed to be noiseless. Example 1 (circles) is basically superimposed on the grand average; example 2 (triangles) is displaced, but with roughly the same trend of the grand average; and example 3 (squares) has a trend different from the grand average. b) The difference between each of the three spectra, shown in panel a) and the grand average; the three straight lines represent the linear fit of each of the three differential spectra. On the right side are shown the three differences between the linear fits and the data shown in panel b), relative to example 1 (panel c)), example 2 (panel d)), and example 3 (panel e)), respectively.
Current usage metrics show cumulative count of Article Views (full-text article views including HTML views, PDF and ePub downloads, according to the available data) and Abstracts Views on Vision4Press platform.
Data correspond to usage on the plateform after 2015. The current usage metrics is available 48-96 hours after online publication and is updated daily on week days.
Initial download of the metrics may take a while.