Fig. 4
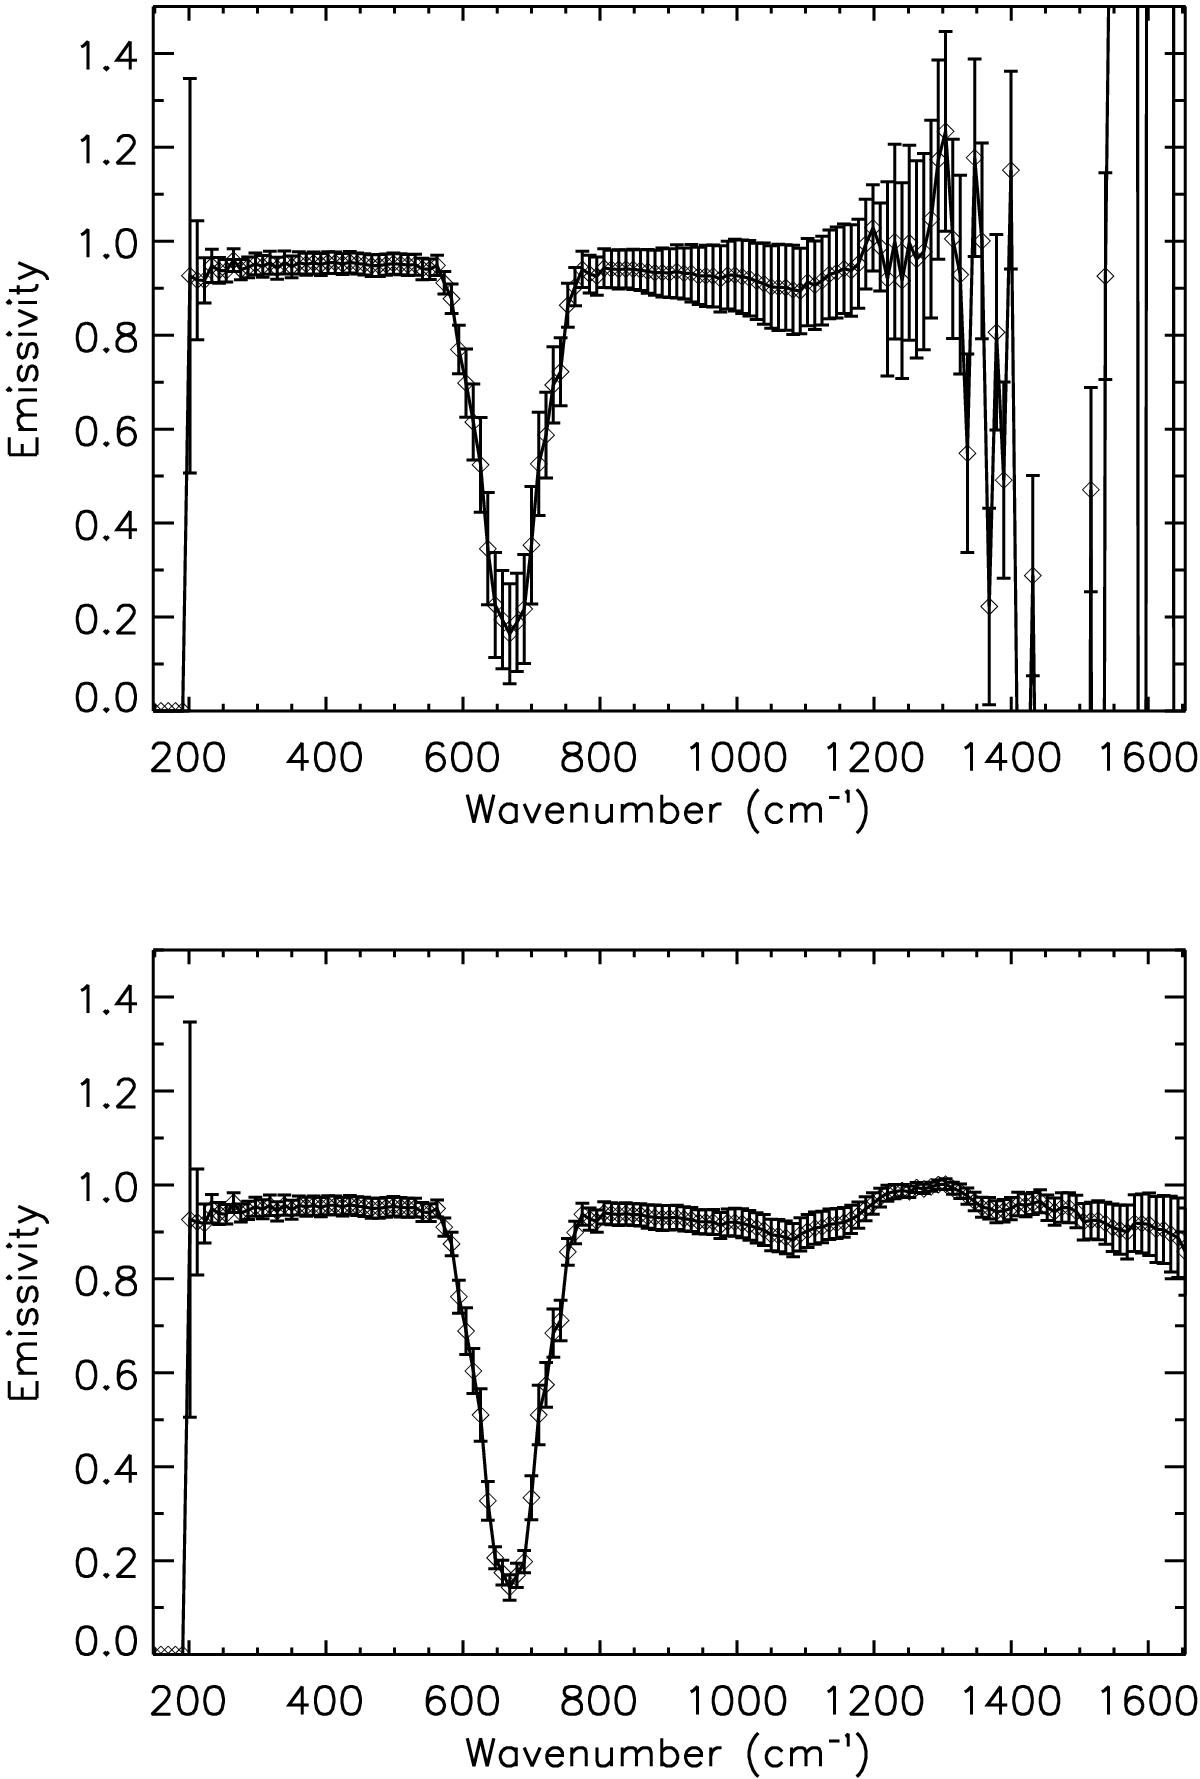
Top panel: average and standard deviation of the 977 561 TES spectra belonging to Ls = 180° ± 5° of MY24 without any preprocessing. Bottom panel: average and standard deviation of the remaining 782 478 TES spectra after applying the two initial preprocessing steps described in the text.
Current usage metrics show cumulative count of Article Views (full-text article views including HTML views, PDF and ePub downloads, according to the available data) and Abstracts Views on Vision4Press platform.
Data correspond to usage on the plateform after 2015. The current usage metrics is available 48-96 hours after online publication and is updated daily on week days.
Initial download of the metrics may take a while.