Fig. 2
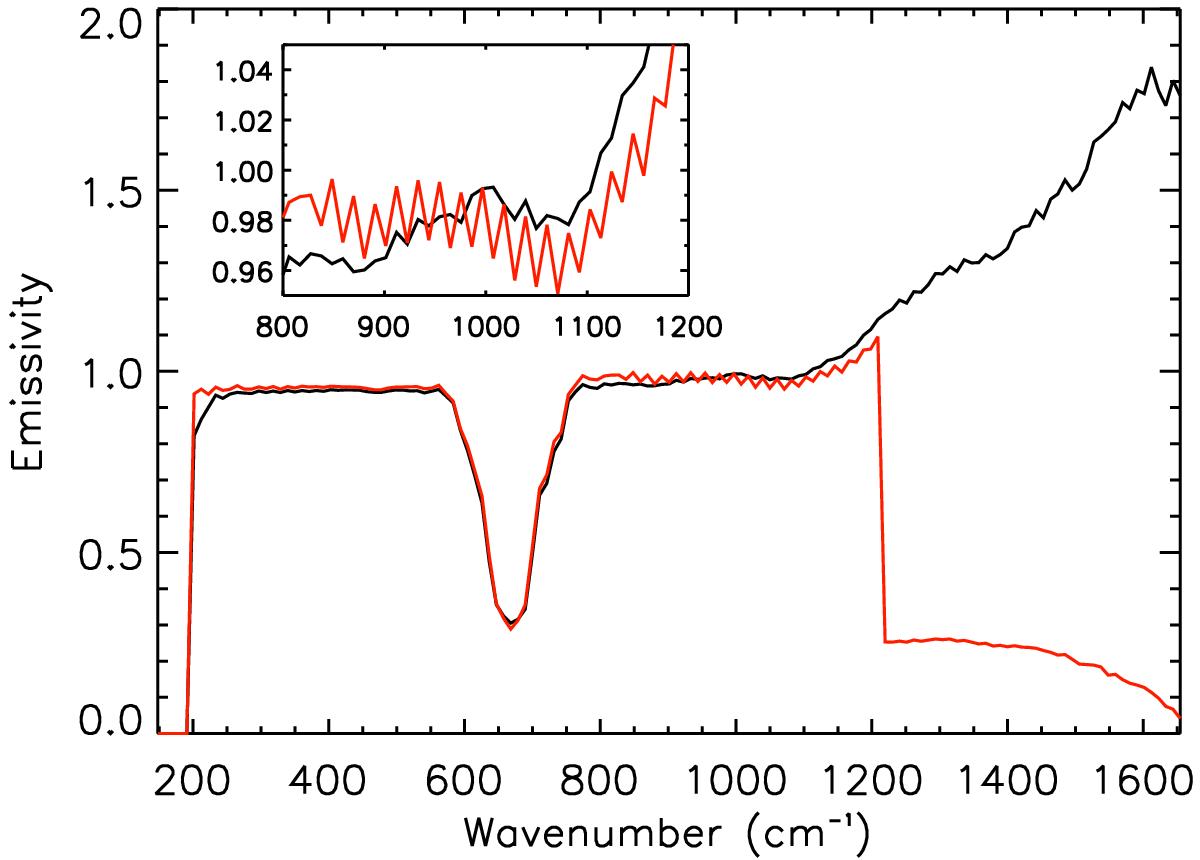
Two examples of anomalous spectra belonging to the dataset Ls = 180° ± 5° of MY24. One of the spectra (black line) has emissivity values increasing constantly well above 1 in the high wavenumber region, while the other (red line) shows a sudden drop in emissivity at about 1200 cm-1 and a systematic ripple (inset: see text) between 800 and 1200 cm-1.
Current usage metrics show cumulative count of Article Views (full-text article views including HTML views, PDF and ePub downloads, according to the available data) and Abstracts Views on Vision4Press platform.
Data correspond to usage on the plateform after 2015. The current usage metrics is available 48-96 hours after online publication and is updated daily on week days.
Initial download of the metrics may take a while.