Fig. 11
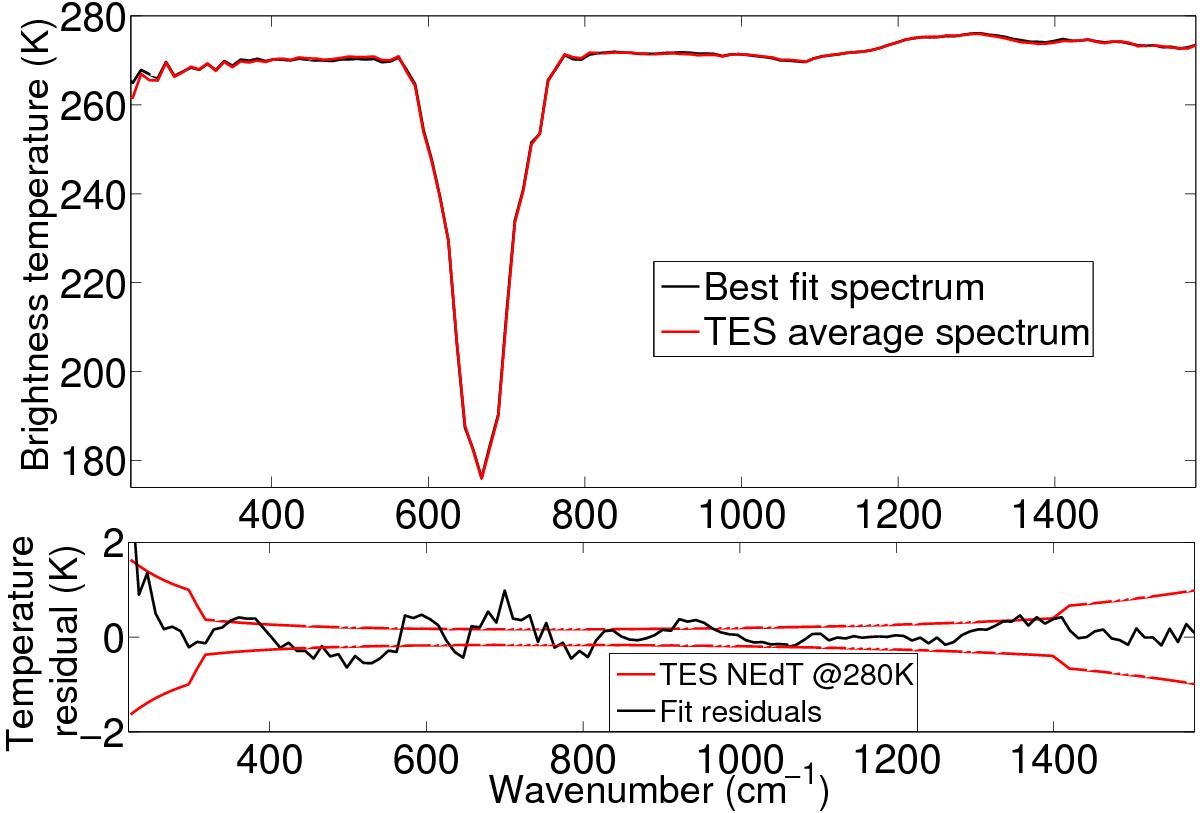
Top panel: comparison of the average TES spectrum (red line), of the pre-processed dataset, with the best-fit synthetic spectrum (black line). Bottom panel: comparison between the residual brightness temperature differences between the two spectra shown in the top panel and the expected TES NEdT for a brightness temperature of 280 K.
Current usage metrics show cumulative count of Article Views (full-text article views including HTML views, PDF and ePub downloads, according to the available data) and Abstracts Views on Vision4Press platform.
Data correspond to usage on the plateform after 2015. The current usage metrics is available 48-96 hours after online publication and is updated daily on week days.
Initial download of the metrics may take a while.