Fig. 1
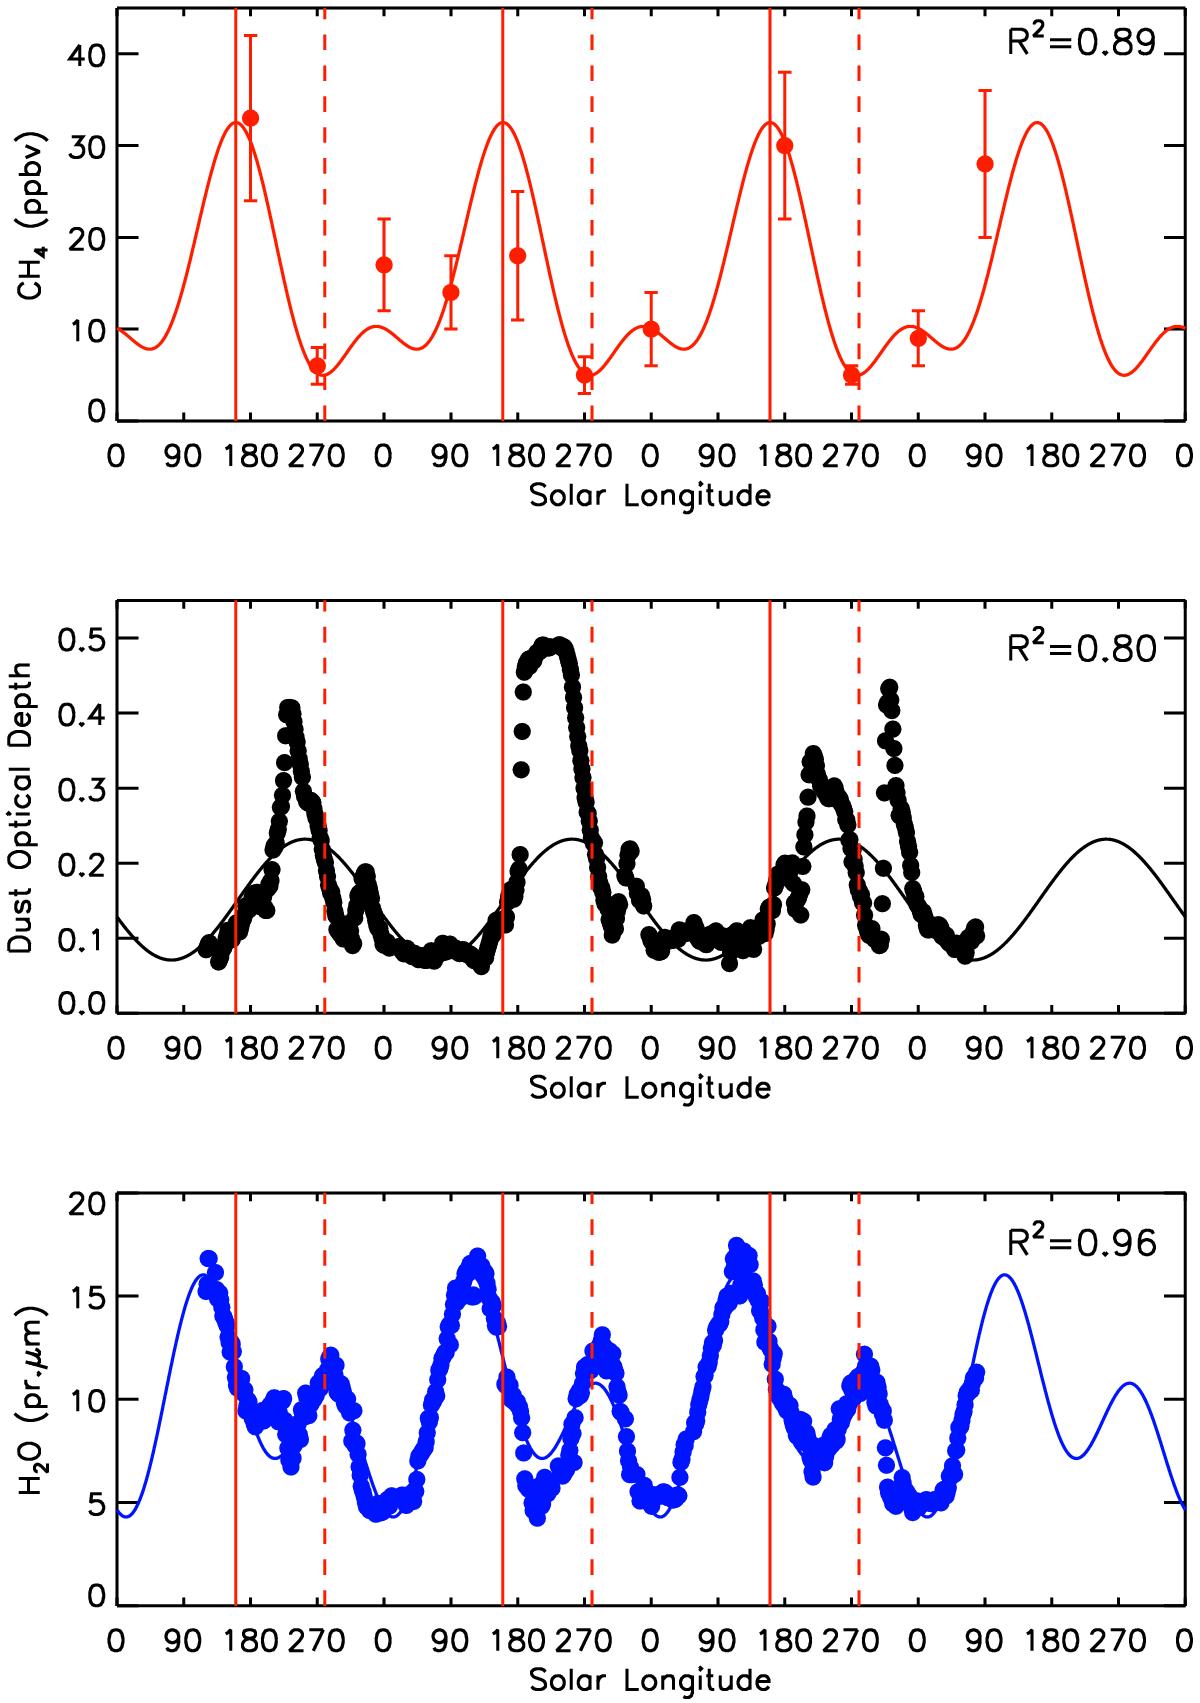
Seasonal variation of the global methane content in the Martian atmosphere (top panel, points from Fonti & Marzo 2010) compared to the data (points) analyzed by Smith (2004) for atmospheric dust (central panel; the dust optical depth is evaluated at 1075 cm-1) and water vapor (bottom panel). The data, fit with a double sinusoidal function (solid lines), seem to suggest a possible methane cycle, with possible phase correlations to dust and water vapor cycles. The two red vertical lines mark the maxima (solid) and minima (dashed) of the fit methane. The determination coefficient R2 is given for each fit, R2 = 1 corresponding to the perfect fit.
Current usage metrics show cumulative count of Article Views (full-text article views including HTML views, PDF and ePub downloads, according to the available data) and Abstracts Views on Vision4Press platform.
Data correspond to usage on the plateform after 2015. The current usage metrics is available 48-96 hours after online publication and is updated daily on week days.
Initial download of the metrics may take a while.