Fig. 1
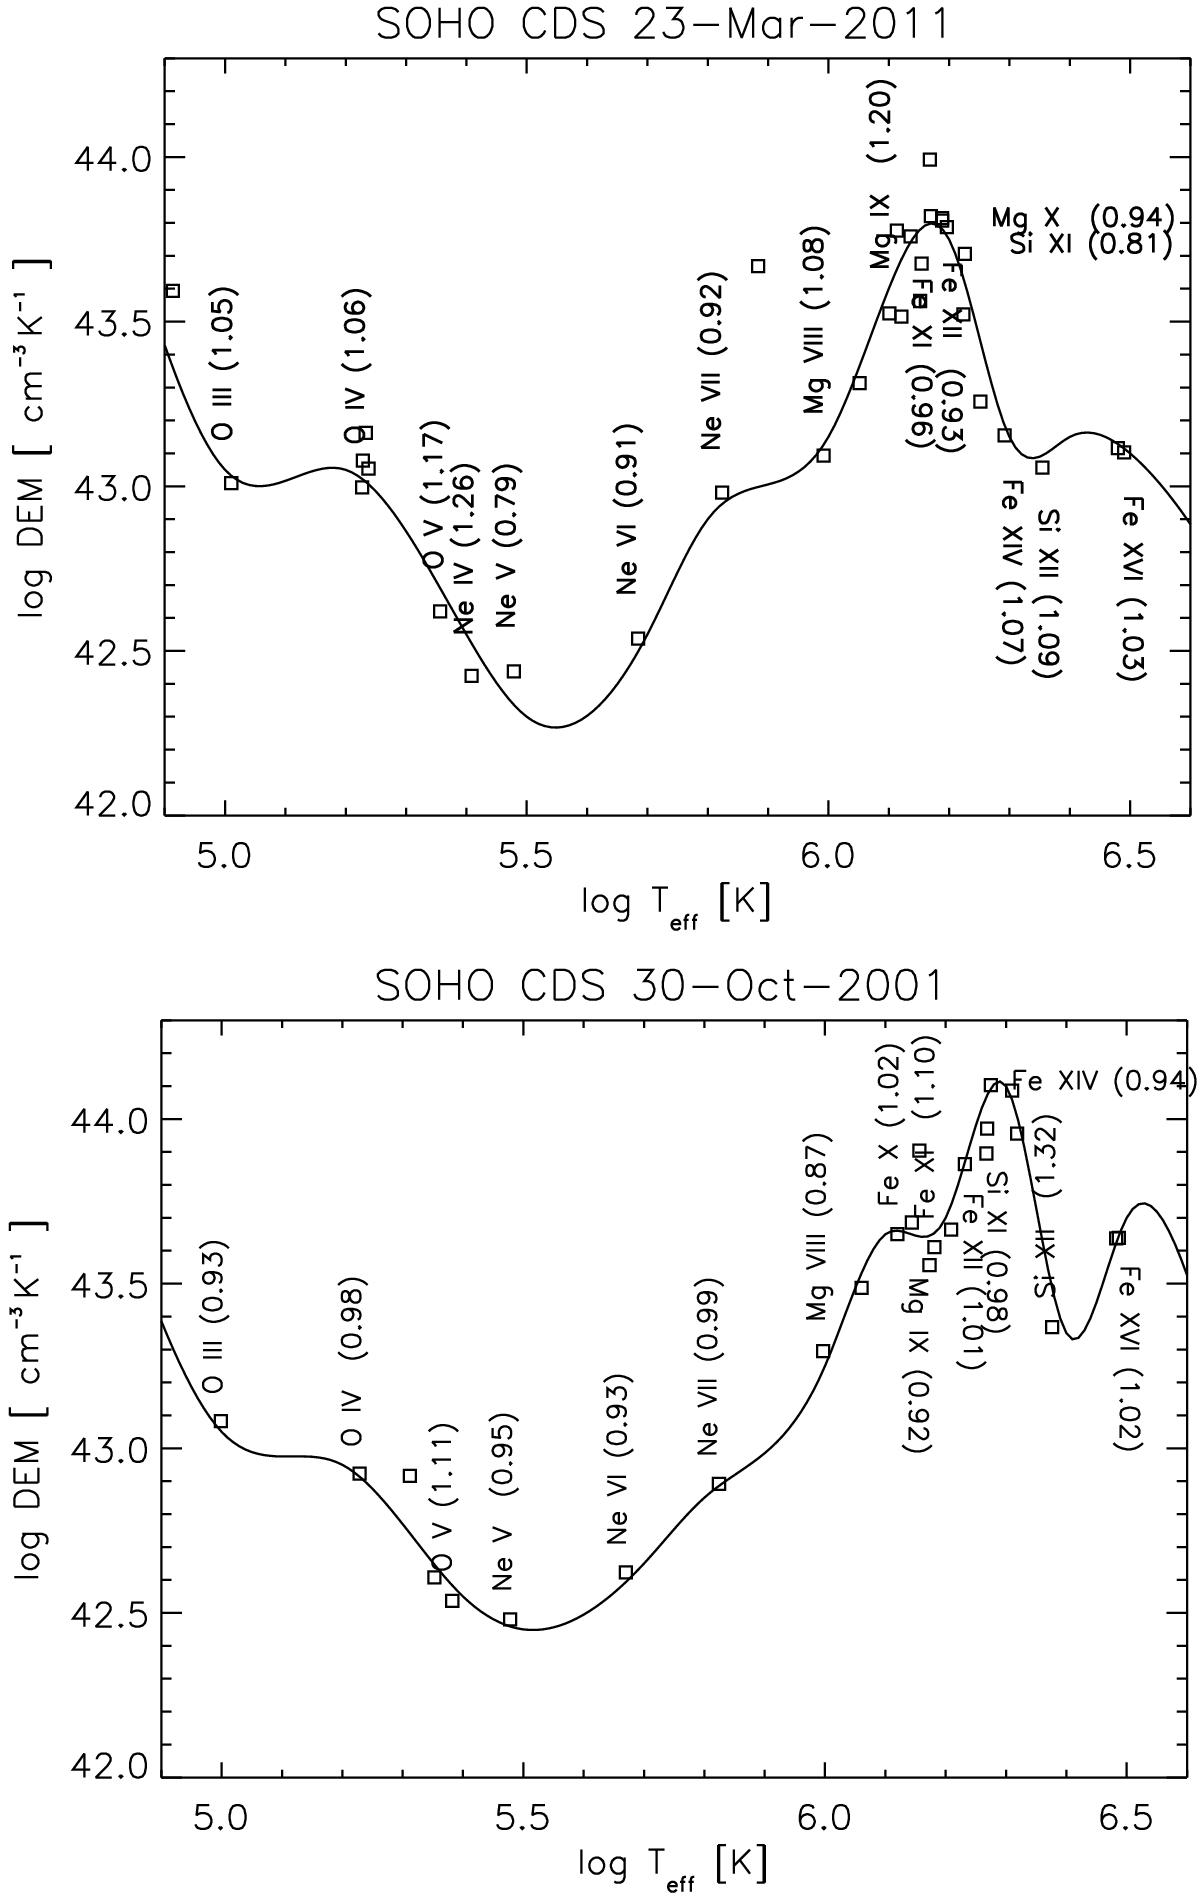
Top: DEM distribution for 23 Mar. 2011, representative of a period of relatively low solar activity. Bottom: the DEM distribution for the 30 Oct. 2001, representative of a period of relatively high solar activity. The points are displayed at the effective temperature (see text). The labels indicate the main ion and the ratio of the predicted vs. observed irradiance.
Current usage metrics show cumulative count of Article Views (full-text article views including HTML views, PDF and ePub downloads, according to the available data) and Abstracts Views on Vision4Press platform.
Data correspond to usage on the plateform after 2015. The current usage metrics is available 48-96 hours after online publication and is updated daily on week days.
Initial download of the metrics may take a while.