Fig. 6
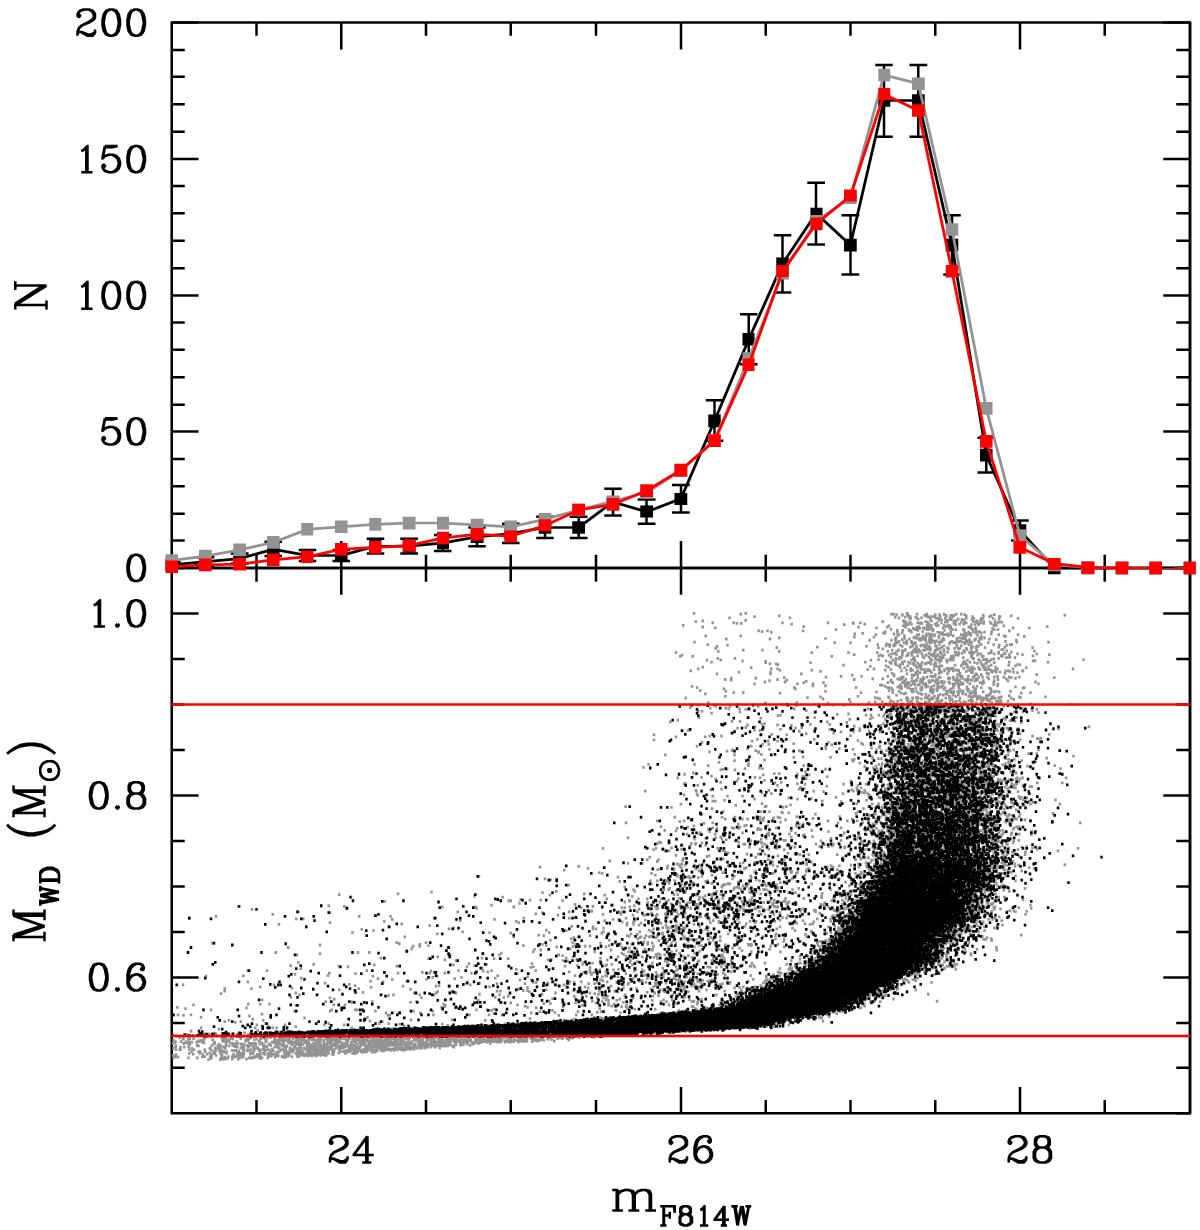
Top panel: clean white dwarf luminosity function of NGC 6397 (black line) compared with the synthetic luminosity function for the entire sample of white dwarfs (gray line) and that obtained after eliminating massive and low-mass white dwarfs (red line). Bottom panel: mass distribution as a function of the magnitude for our simulated sample (black dots). The mass cuts are also displayed in this panel as horizontal red lines.
Current usage metrics show cumulative count of Article Views (full-text article views including HTML views, PDF and ePub downloads, according to the available data) and Abstracts Views on Vision4Press platform.
Data correspond to usage on the plateform after 2015. The current usage metrics is available 48-96 hours after online publication and is updated daily on week days.
Initial download of the metrics may take a while.