Fig. 9
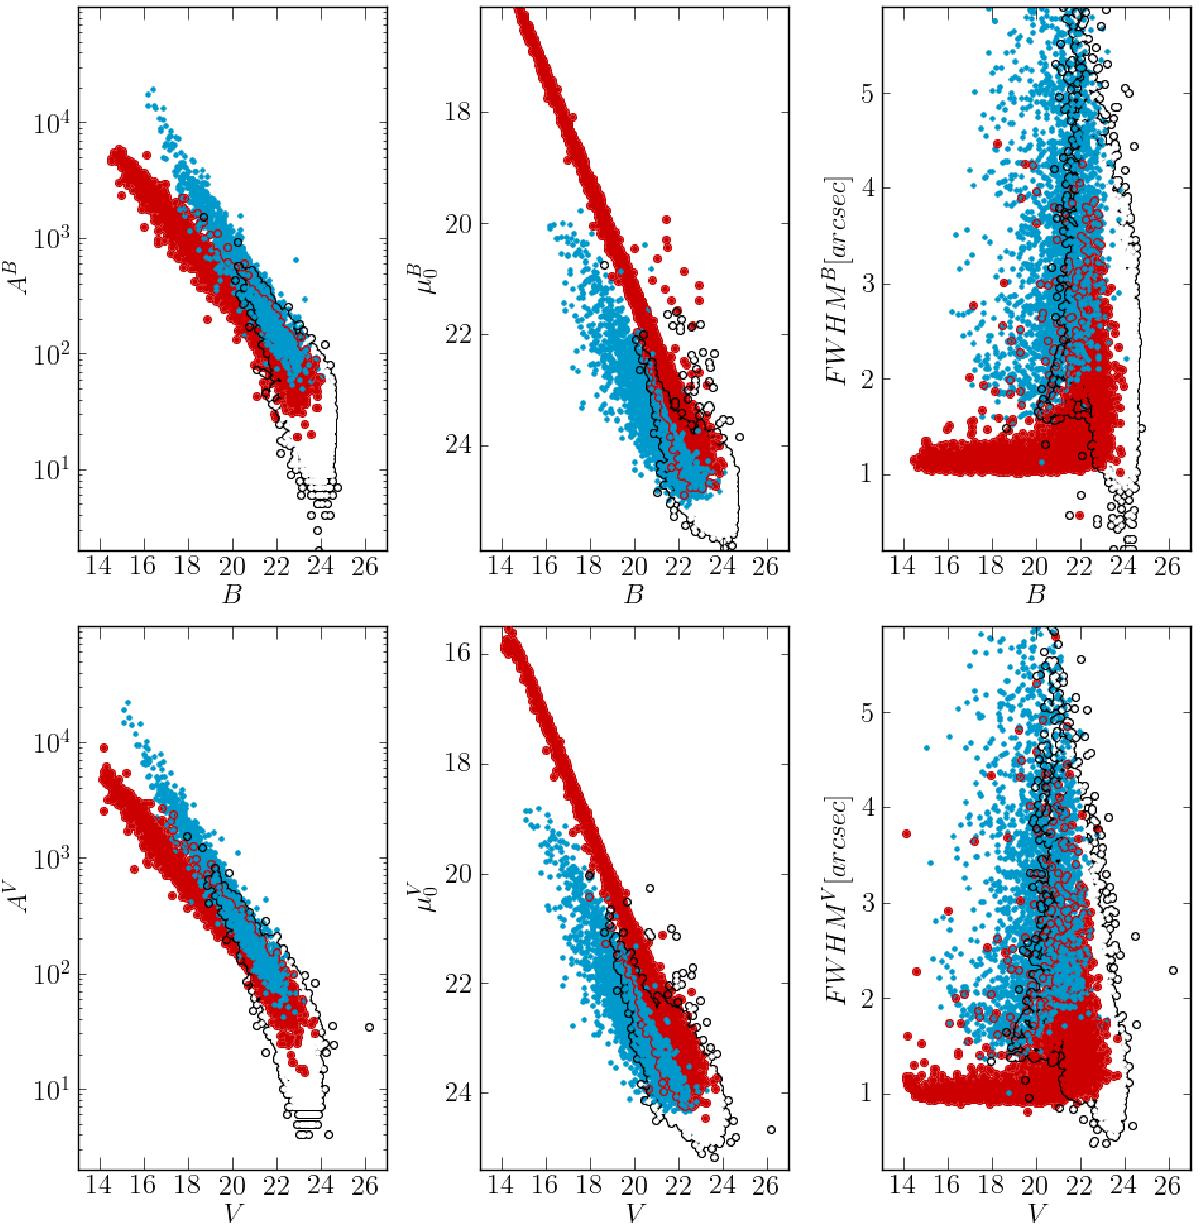
Some of the plots used to classify sources in A3809, see text for details. Since blue dots (galaxies) are plotted on top of red ones (stars), we use red contours to mark (and delimit) the hidden regions occupied by stars. Similarly, black contours define the region where unclassified sources (not individually plotted) are located.
Current usage metrics show cumulative count of Article Views (full-text article views including HTML views, PDF and ePub downloads, according to the available data) and Abstracts Views on Vision4Press platform.
Data correspond to usage on the plateform after 2015. The current usage metrics is available 48-96 hours after online publication and is updated daily on week days.
Initial download of the metrics may take a while.