Fig. 7
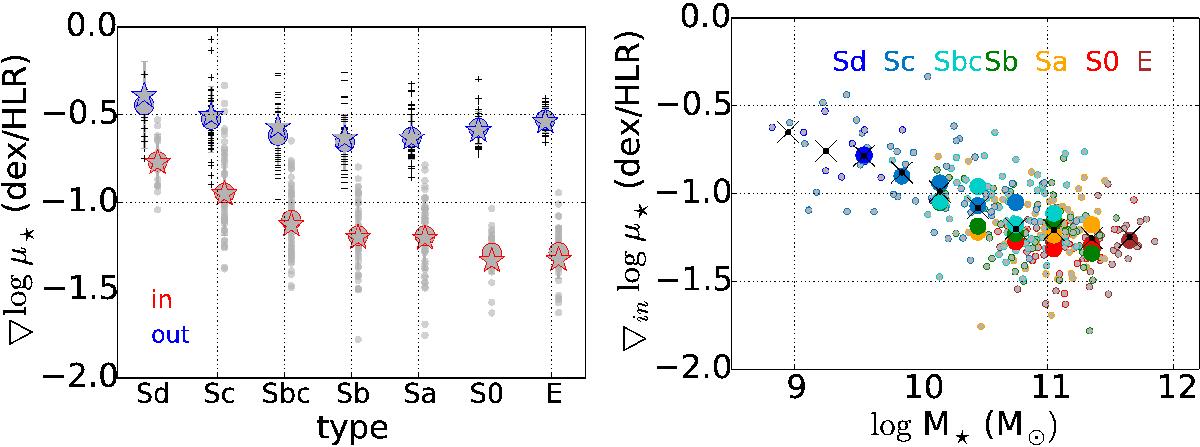
Left panel: correlation between the inner (grey–red) and outer (grey–blue) gradient of log μ⋆ and the morphological type. The results are shown for the GMe (stars) and CBe (circles) SSP models. The inner gradient is calculated between the galaxy nucleus and 1 HLR, and the outer gradient between 1 HLR and 2 HLR. Right panel: correlation between the inner gradient of log μ⋆ and the galaxy stellar mass. Small dots represent the results for each galaxy, and black crosses the average for each 0.3 dex mass bin. Large circles represent the averaged inner gradient in mass intervals of 0.3 dex for each color-coded morphological type. Black crosses show the average correlation between the inner gradient of log μ⋆ and galaxy mass independent of the morphological type.
Current usage metrics show cumulative count of Article Views (full-text article views including HTML views, PDF and ePub downloads, according to the available data) and Abstracts Views on Vision4Press platform.
Data correspond to usage on the plateform after 2015. The current usage metrics is available 48-96 hours after online publication and is updated daily on week days.
Initial download of the metrics may take a while.