Fig. 3
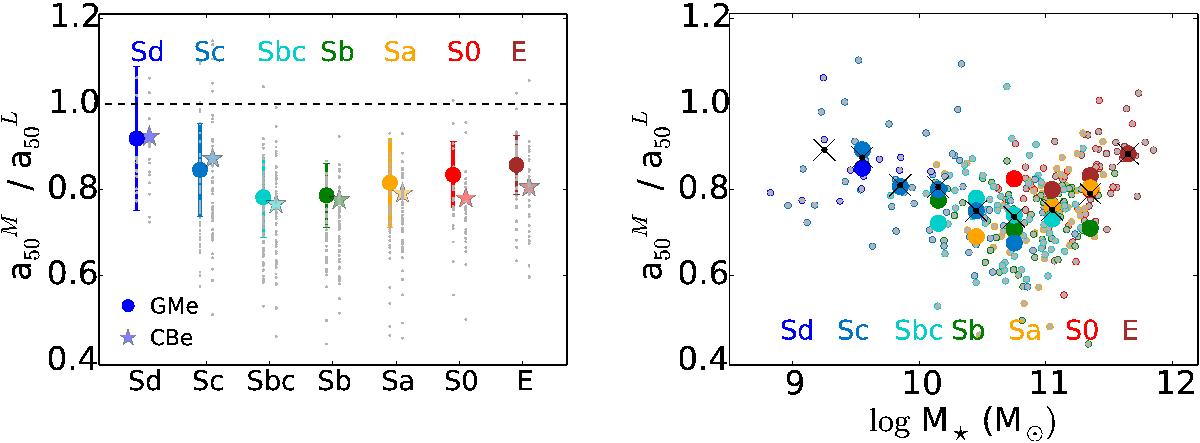
Left: the ratio between half mass and half light radius (a![]() / a
/ a![]() ) with the Hubble type (left). Big colored dots represent the averaged a
) with the Hubble type (left). Big colored dots represent the averaged a![]() / a
/ a![]() in each Hubble type bin, and the lines the dispersion. Stars and big circles show the results obtained with the GMe and CBe bases, respectively. Right: a
in each Hubble type bin, and the lines the dispersion. Stars and big circles show the results obtained with the GMe and CBe bases, respectively. Right: a![]() / a
/ a![]() as a function of the galaxy stellar mass. The black crosses show the averaged correlation independent of the morphological type. Large circles represent the averaged relation in mass intervals of 0.25 dex for each color-coded morphological type.
as a function of the galaxy stellar mass. The black crosses show the averaged correlation independent of the morphological type. Large circles represent the averaged relation in mass intervals of 0.25 dex for each color-coded morphological type.
Current usage metrics show cumulative count of Article Views (full-text article views including HTML views, PDF and ePub downloads, according to the available data) and Abstracts Views on Vision4Press platform.
Data correspond to usage on the plateform after 2015. The current usage metrics is available 48-96 hours after online publication and is updated daily on week days.
Initial download of the metrics may take a while.