Free Access
Fig. 2
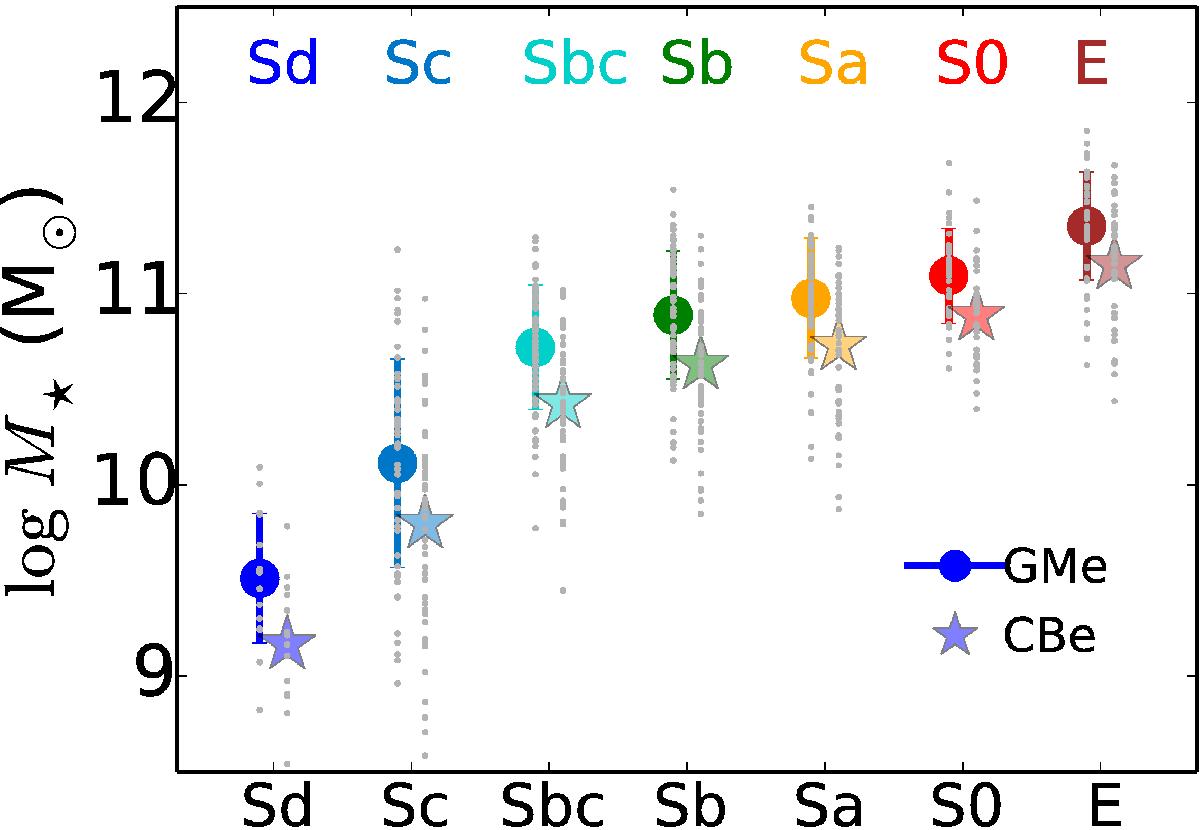
Distribution of the stellar masses obtained from the spatially resolved spectral fits of each galaxy for each Hubble type (grey small points). The colored dots (stars) are the mean galaxy stellar mass in each Hubble type obtained with the GMe (CBe) SSP models. The bars show the dispersion in mass.
Current usage metrics show cumulative count of Article Views (full-text article views including HTML views, PDF and ePub downloads, according to the available data) and Abstracts Views on Vision4Press platform.
Data correspond to usage on the plateform after 2015. The current usage metrics is available 48-96 hours after online publication and is updated daily on week days.
Initial download of the metrics may take a while.