Fig. 18
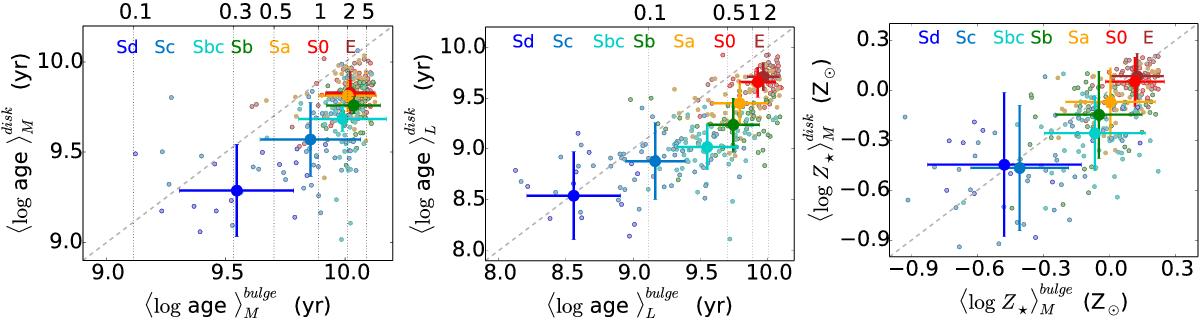
Left panel: mass-weighted age at the galaxy center (⟨log age⟩Mbulge) and at 1.5 HLR (⟨log age⟩Mdisk) for the different Hubble types. Small dots are the individual radial points, while big colored dots represent mean values for each Hubble type, with the error bars indicating the dispersion in the mean. Middle panel: as in the left panel but for the light-weighted age (⟨log age⟩L). Right panel: as in the left panel for ⟨log Z⋆⟩M. The top horizontal axes in the left and middle panels show the redshift scale. The diagonal line in the three panels is the bisector.
Current usage metrics show cumulative count of Article Views (full-text article views including HTML views, PDF and ePub downloads, according to the available data) and Abstracts Views on Vision4Press platform.
Data correspond to usage on the plateform after 2015. The current usage metrics is available 48-96 hours after online publication and is updated daily on week days.
Initial download of the metrics may take a while.