Fig. 1
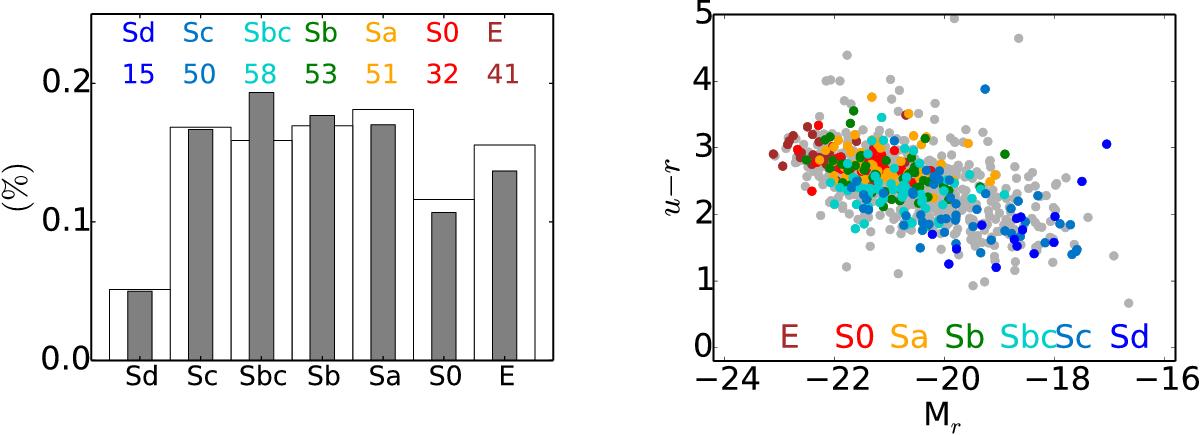
Left: comparison of the distribution of Hubble types in the CALIFA mother sample (empty bars) and the galaxies analyzed here (filled bars). The number of galaxies in our sample are labeled in colors. The histograms are normalized to form a probability density, i.e., each bar scales with the ratio of the number of galaxies in each bin and the total number of galaxies, such that the two distributions are directly comparable. Right: color-magnitude diagram. Mother sample galaxies are plotted in grey, while the 300 galaxies analyzed in this work are marked as colored points.
Current usage metrics show cumulative count of Article Views (full-text article views including HTML views, PDF and ePub downloads, according to the available data) and Abstracts Views on Vision4Press platform.
Data correspond to usage on the plateform after 2015. The current usage metrics is available 48-96 hours after online publication and is updated daily on week days.
Initial download of the metrics may take a while.