Fig. 11
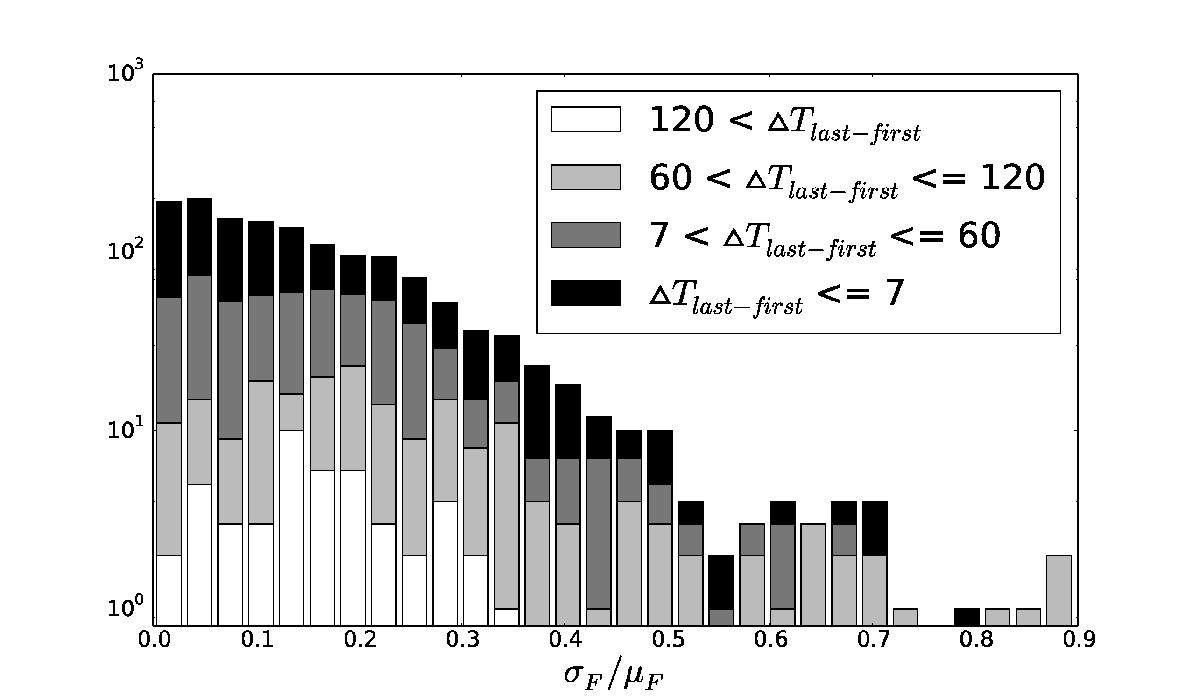
Distribution of variability σF/μF (standard deviation of F divided by its mean) for the 1430 objects with more than one observation. The histogram shows four groups of different timespan ranges ▵T in days. Objects with the longest timespan (white) show small variability, while some of those with the shortest timespan (black) can exhibit significant changes. Objects within the group of the third longest timespan (light grey) display the strongest variation of their Hα profile.
Current usage metrics show cumulative count of Article Views (full-text article views including HTML views, PDF and ePub downloads, according to the available data) and Abstracts Views on Vision4Press platform.
Data correspond to usage on the plateform after 2015. The current usage metrics is available 48-96 hours after online publication and is updated daily on week days.
Initial download of the metrics may take a while.