Free Access
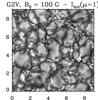
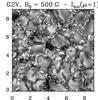
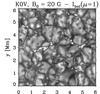
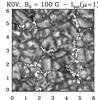
Fig. 1

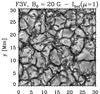
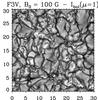
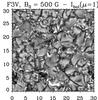
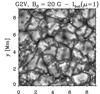
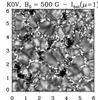
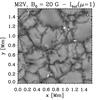
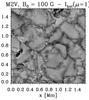
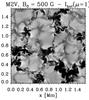
Maps of the vertical bolometric intensity for twelve of the 18 magnetic simulation runs. For improved image contrast, the grey scale saturates at the values indicated by the colour scales on the right of each row.
This figure is made of several images, please see below:
Current usage metrics show cumulative count of Article Views (full-text article views including HTML views, PDF and ePub downloads, according to the available data) and Abstracts Views on Vision4Press platform.
Data correspond to usage on the plateform after 2015. The current usage metrics is available 48-96 hours after online publication and is updated daily on week days.
Initial download of the metrics may take a while.