Free Access
Fig. 3
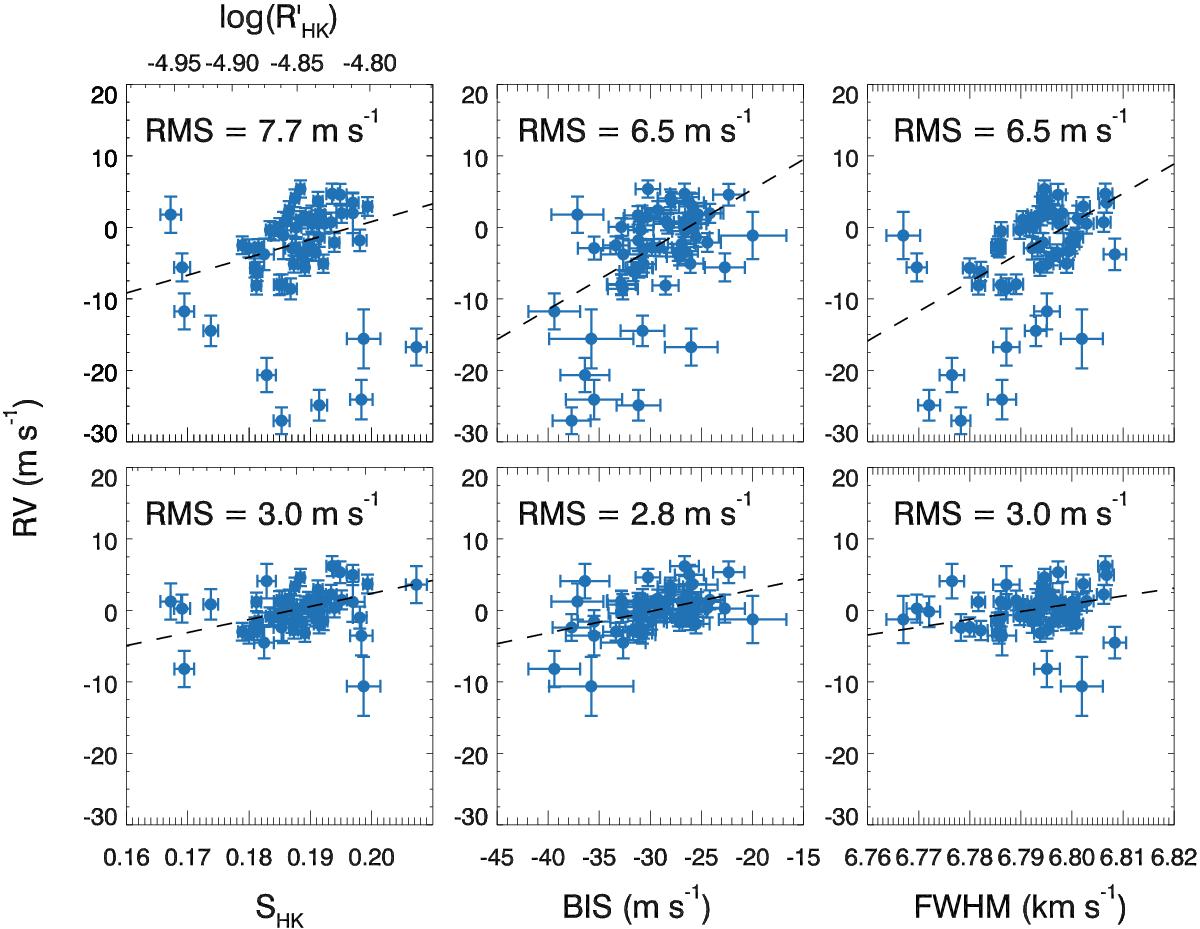
Correlations for the activity tracers SHK, BIS, and FWHM with RV. The upper panels shows the observed RVs. The lower panels show the residuals to the 3800-day signal fit (as presented in Sect. 3.1). Dashed lines are linear least-squares best fits to the data.
Current usage metrics show cumulative count of Article Views (full-text article views including HTML views, PDF and ePub downloads, according to the available data) and Abstracts Views on Vision4Press platform.
Data correspond to usage on the plateform after 2015. The current usage metrics is available 48-96 hours after online publication and is updated daily on week days.
Initial download of the metrics may take a while.