Fig. 6
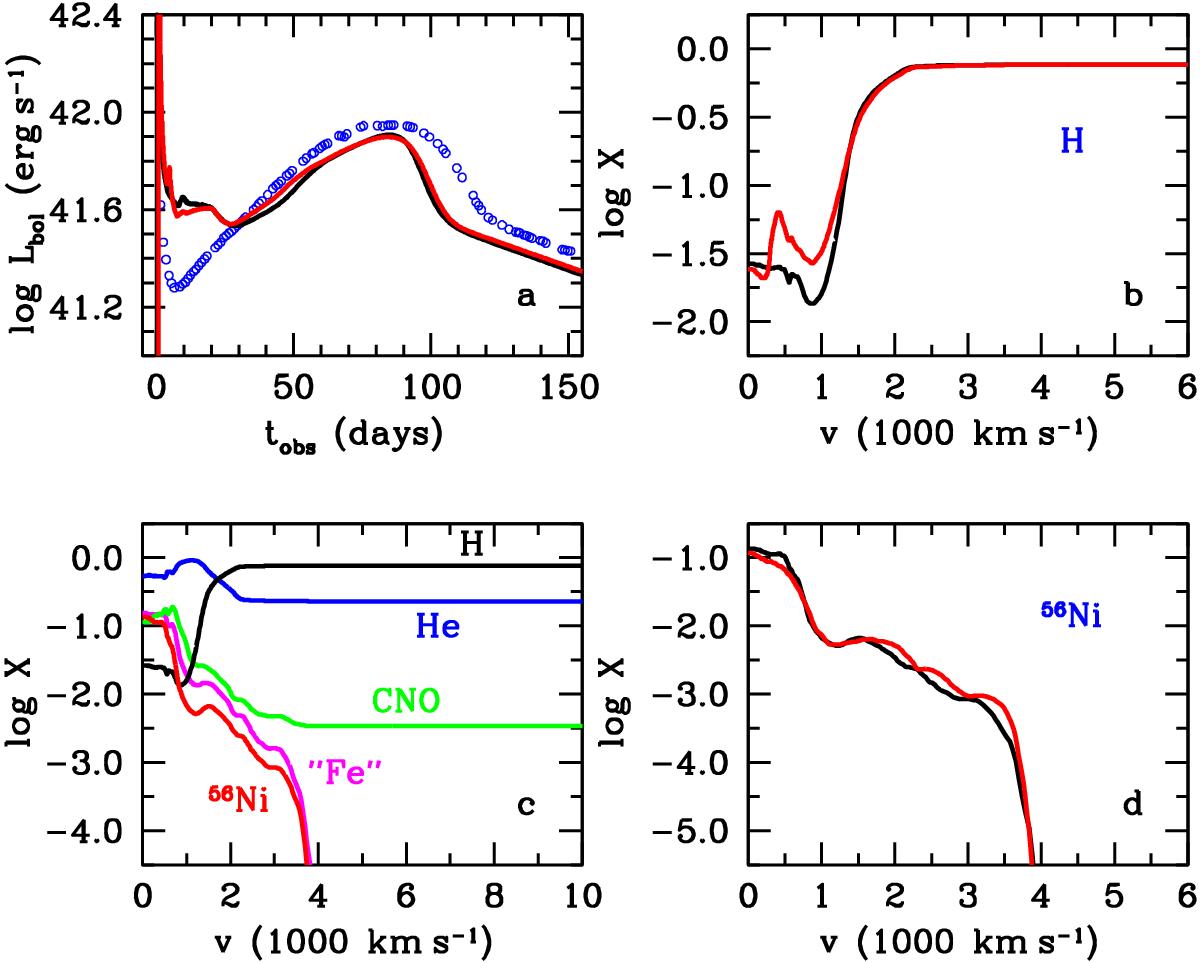
Comparison of the early- and late-time 1D simulations for model B15-2 with the representative radioactive 56Ni mass (Table 2). Panel a): bolometric light curves of the early-time (black line) and late-time (red line) 1D simulations compared with the observations of SN 1987A obtained by Catchpole et al. (1987, 1988) (open circles). Panels b) and d): mass fractions of hydrogen and radioactive 56Ni, respectively, as functions of velocity for the early-time (black line) and late-time (red line) 1D simulations. Panel c): mass fractions as functions of velocity for the early-time 1D simulation. The red line is the mass fraction of radioactive 56Ni (see also Fig. 2). All profiles of the mass fractions are given at t = 50 days.
Current usage metrics show cumulative count of Article Views (full-text article views including HTML views, PDF and ePub downloads, according to the available data) and Abstracts Views on Vision4Press platform.
Data correspond to usage on the plateform after 2015. The current usage metrics is available 48-96 hours after online publication and is updated daily on week days.
Initial download of the metrics may take a while.