Fig. 11
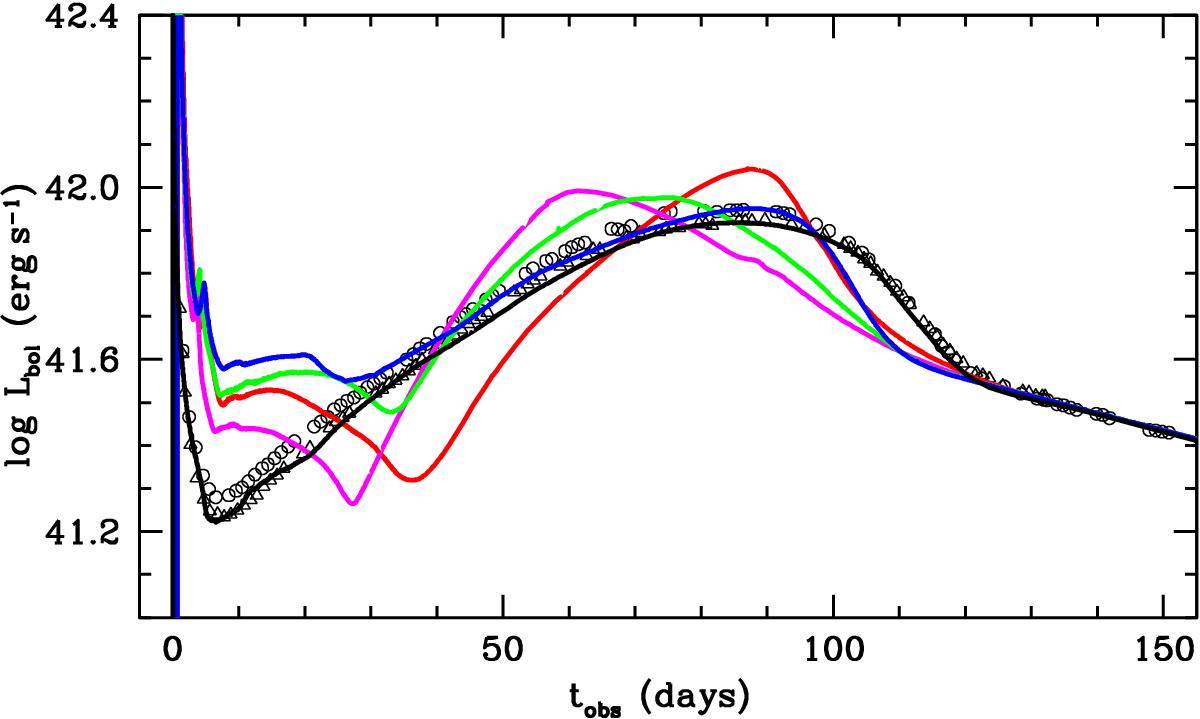
Bolometric light curves of models B15-2 (blue line), N20-P (green line), W18 (magenta line), and W20 (red line) for the late-time 1D simulations compared with the observations of SN 1987A obtained by Catchpole et al. (1987, 1988) (open circles) and Hamuy et al. (1988) (open triangles). In all models the total 56Ni mass is scaled to fit the observed luminosity in the radioactive tail (see Table 4). In contrast, the black line shows the bolometric light curve of an optimal model with a nonevolutionary pre-SN (Utrobin 2005, see also Fig. 1).
Current usage metrics show cumulative count of Article Views (full-text article views including HTML views, PDF and ePub downloads, according to the available data) and Abstracts Views on Vision4Press platform.
Data correspond to usage on the plateform after 2015. The current usage metrics is available 48-96 hours after online publication and is updated daily on week days.
Initial download of the metrics may take a while.