Fig. 1
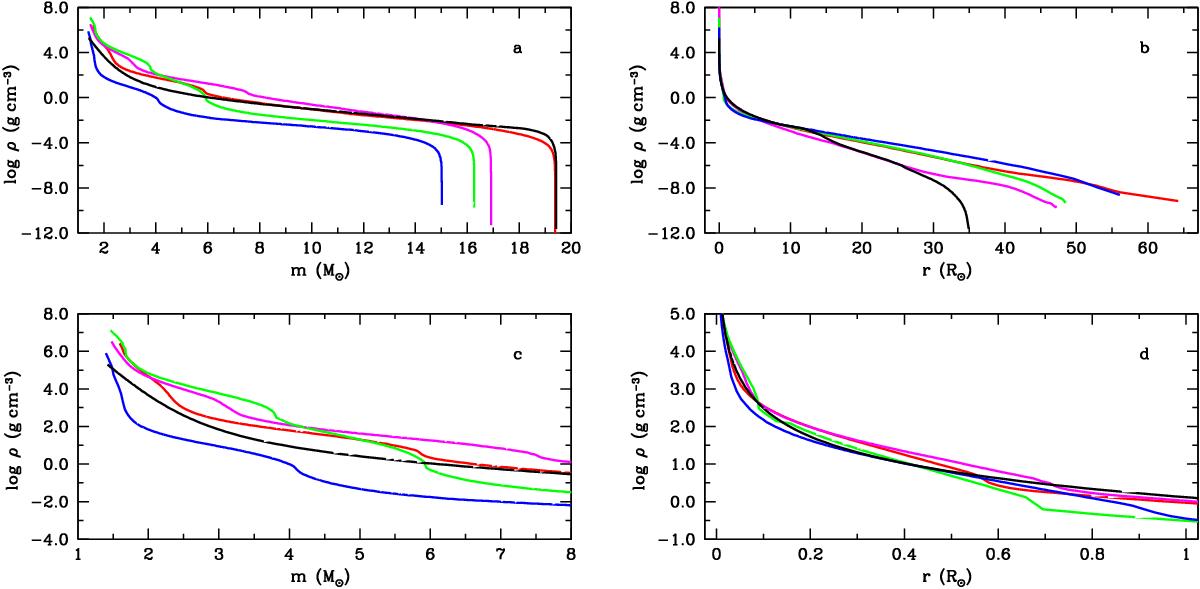
Density distributions as functions of interior mass for the whole star (panel a)) and the inner region of 8 M⊙ (panel c)) and as functions of radius for the whole star (panel b)) and the inner region of 1 R⊙ (panel d)) in pre-SN models B15 (blue line), N20 (green line), W18 (magenta line), and W20 (red line). The central collapsing cores are omitted. For a comparison, the black line shows the structure of a nonevolutionary pre-SN model used by Utrobin (2005).
Current usage metrics show cumulative count of Article Views (full-text article views including HTML views, PDF and ePub downloads, according to the available data) and Abstracts Views on Vision4Press platform.
Data correspond to usage on the plateform after 2015. The current usage metrics is available 48-96 hours after online publication and is updated daily on week days.
Initial download of the metrics may take a while.