Free Access
Fig. 2
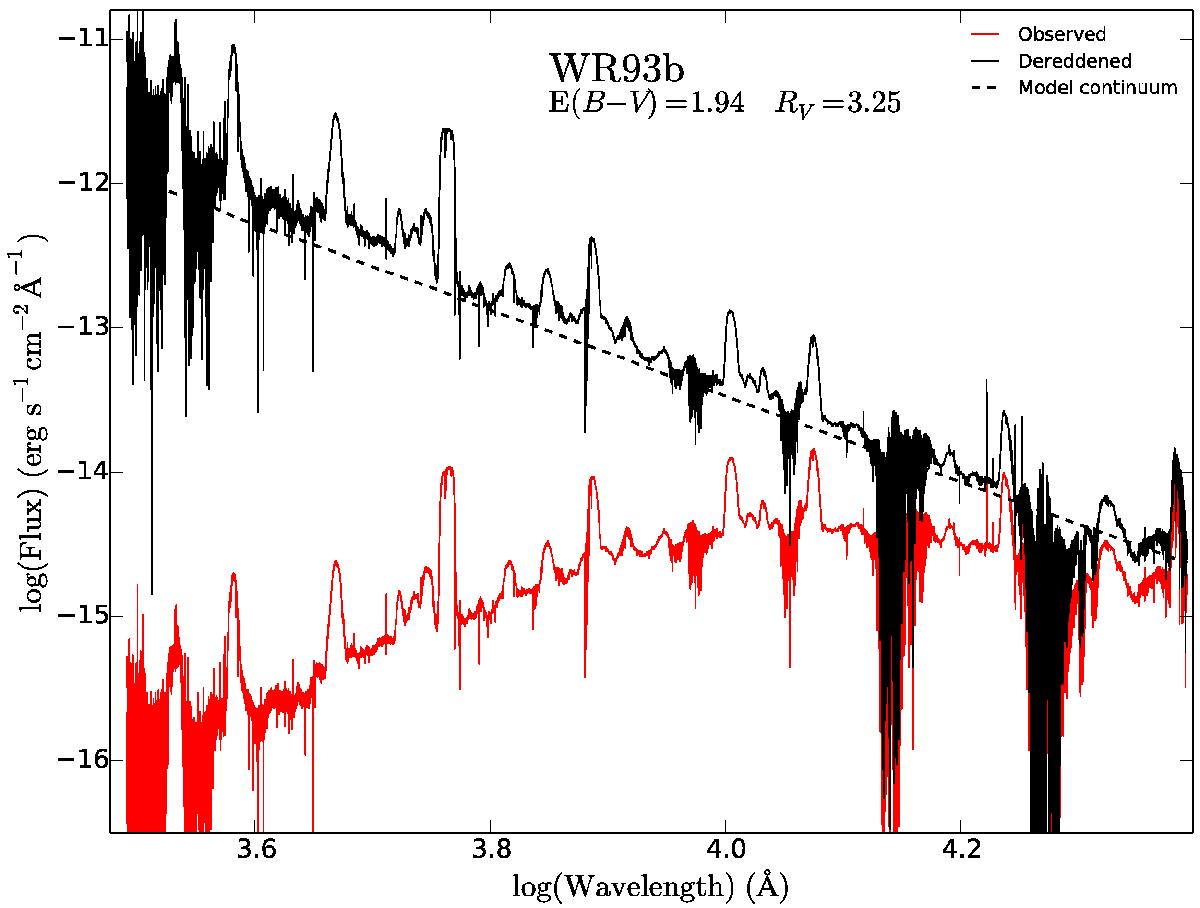
Example of the extinction correction procedure for the highly reddened WR93b. The flux-calibrated spectrum before and after the extinction correction is shown in red and black, respectively. The scaled continuum of a model spectrum is indicated by the dashed black line.
Current usage metrics show cumulative count of Article Views (full-text article views including HTML views, PDF and ePub downloads, according to the available data) and Abstracts Views on Vision4Press platform.
Data correspond to usage on the plateform after 2015. The current usage metrics is available 48-96 hours after online publication and is updated daily on week days.
Initial download of the metrics may take a while.