Free Access
Fig. 1
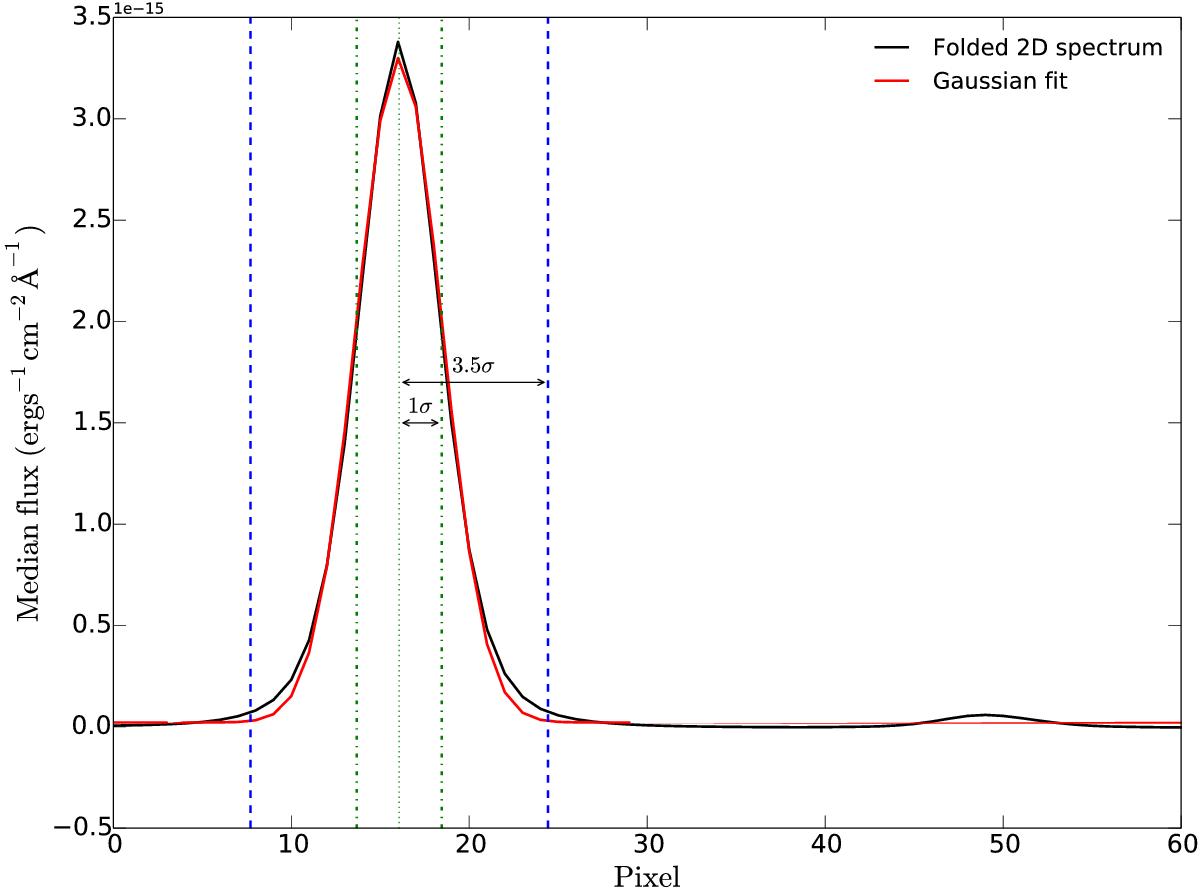
Example of the extraction of the 1D spectrum of WR30a for one of the nodding positions. The cross-dispersed profile is shown in black, the Gaussian fit in red. The blue dashed lines indicate the region that is extracted (corresponding to ± 3.5σ, with σ the standard deviation of the fitted Gaussian profile).
Current usage metrics show cumulative count of Article Views (full-text article views including HTML views, PDF and ePub downloads, according to the available data) and Abstracts Views on Vision4Press platform.
Data correspond to usage on the plateform after 2015. The current usage metrics is available 48-96 hours after online publication and is updated daily on week days.
Initial download of the metrics may take a while.