Free Access
Fig. 16
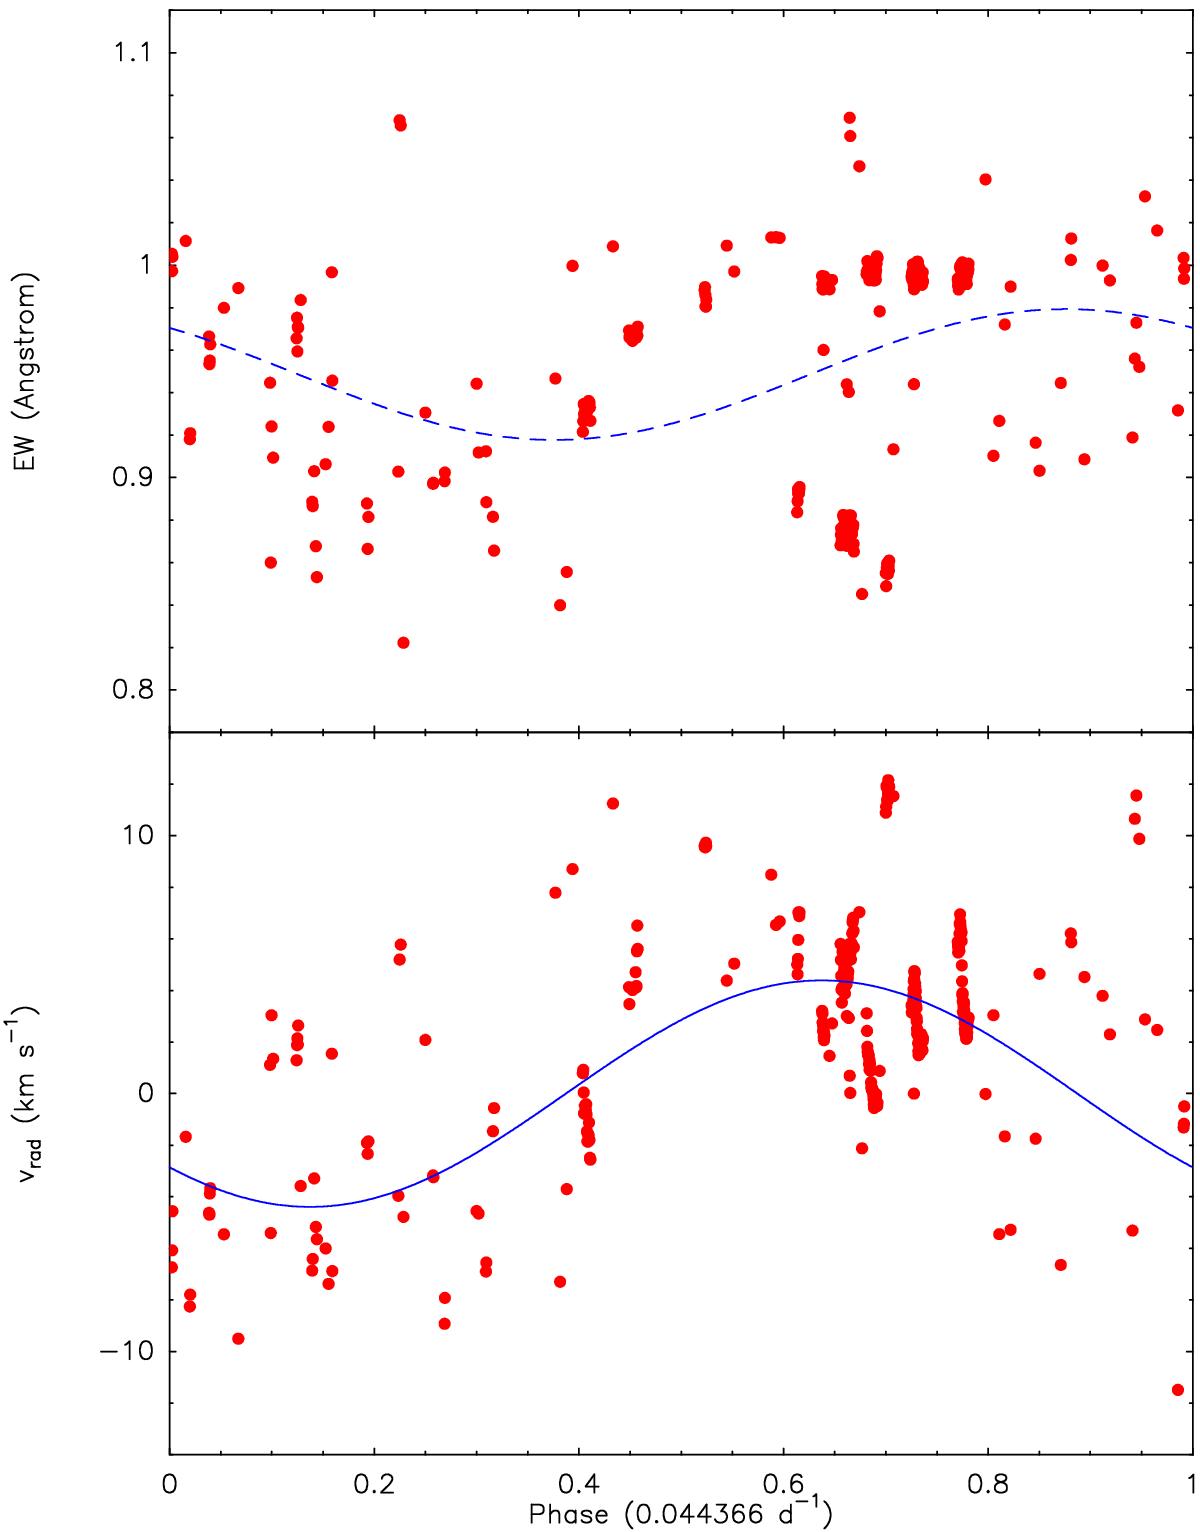
Radial velocity and EW of the H i λ6678 line phased to the longest period (22.5 d). The corresponding sine curve with the parameters from Table 3 is included in the phase diagram of the radial velocity, and a tentative fit to the EW, which reveals the same period but is phase-shifted.
Current usage metrics show cumulative count of Article Views (full-text article views including HTML views, PDF and ePub downloads, according to the available data) and Abstracts Views on Vision4Press platform.
Data correspond to usage on the plateform after 2015. The current usage metrics is available 48-96 hours after online publication and is updated daily on week days.
Initial download of the metrics may take a while.