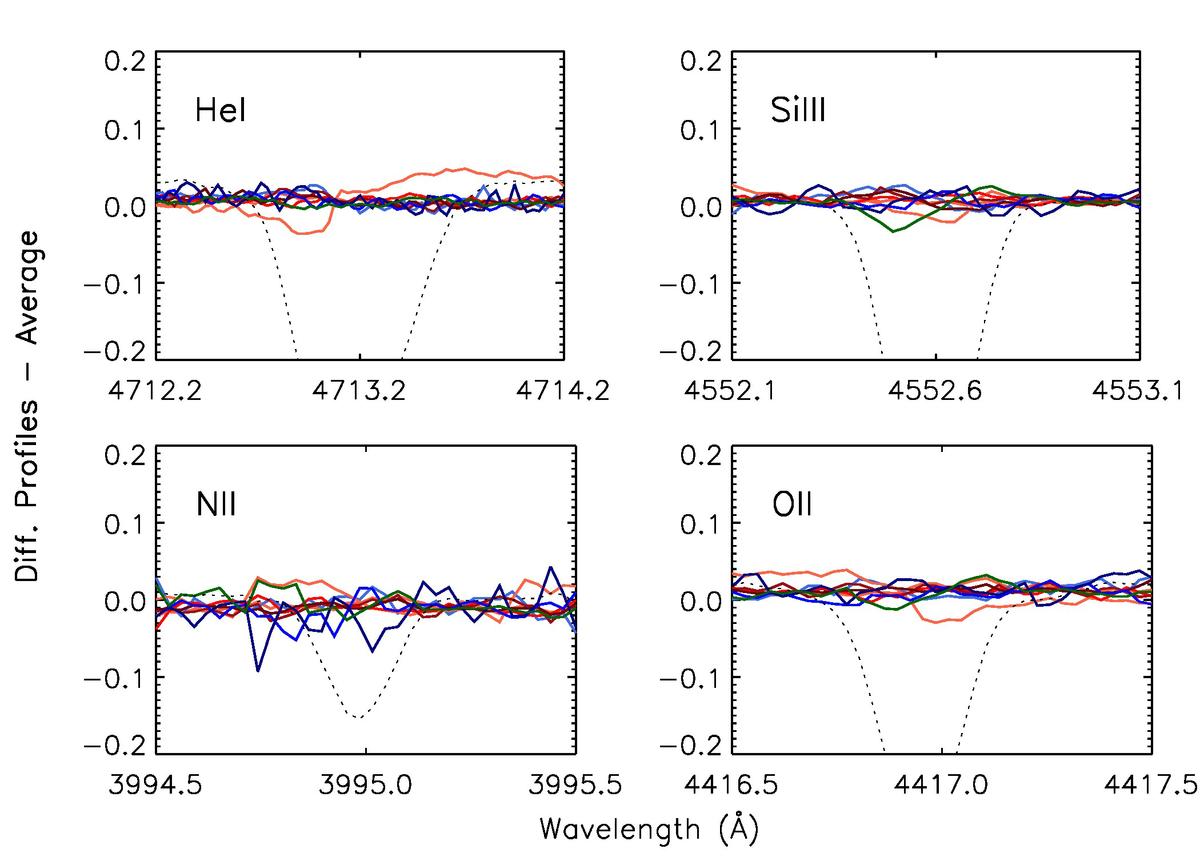
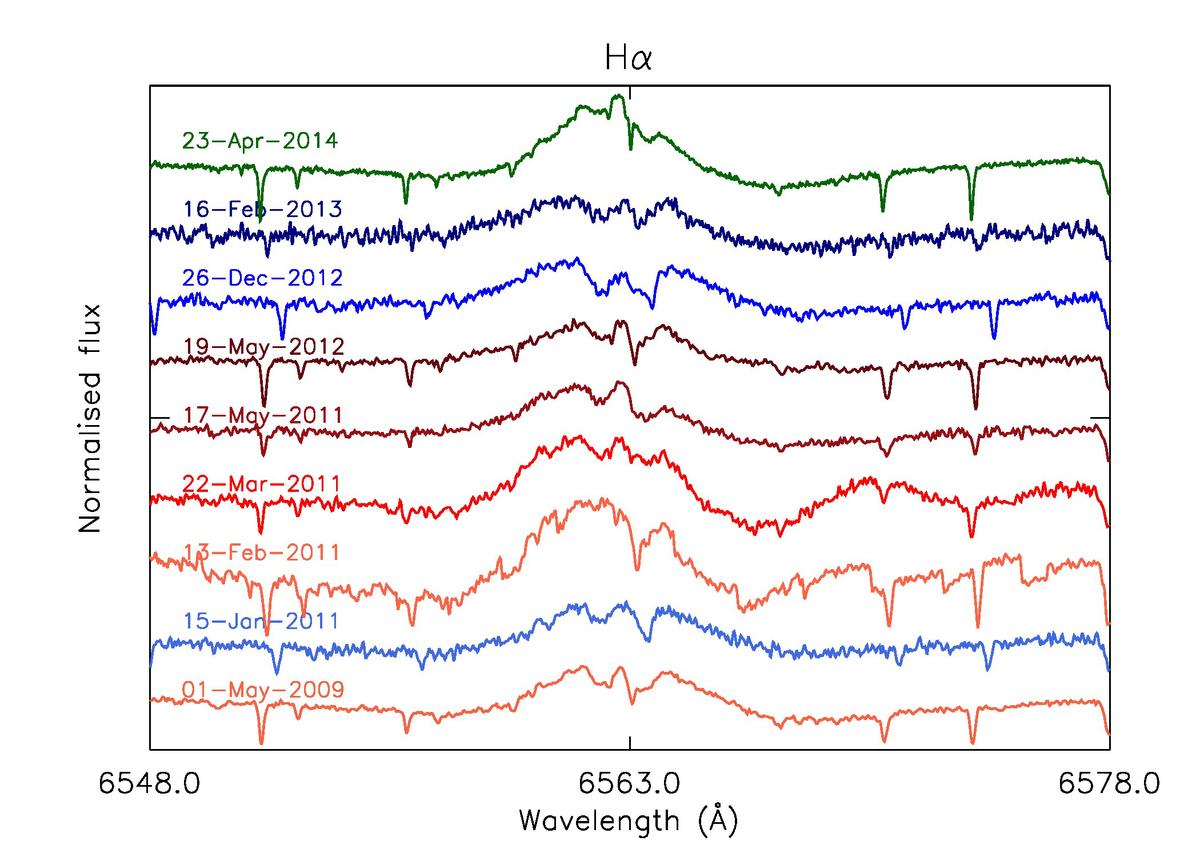
Fig. 9
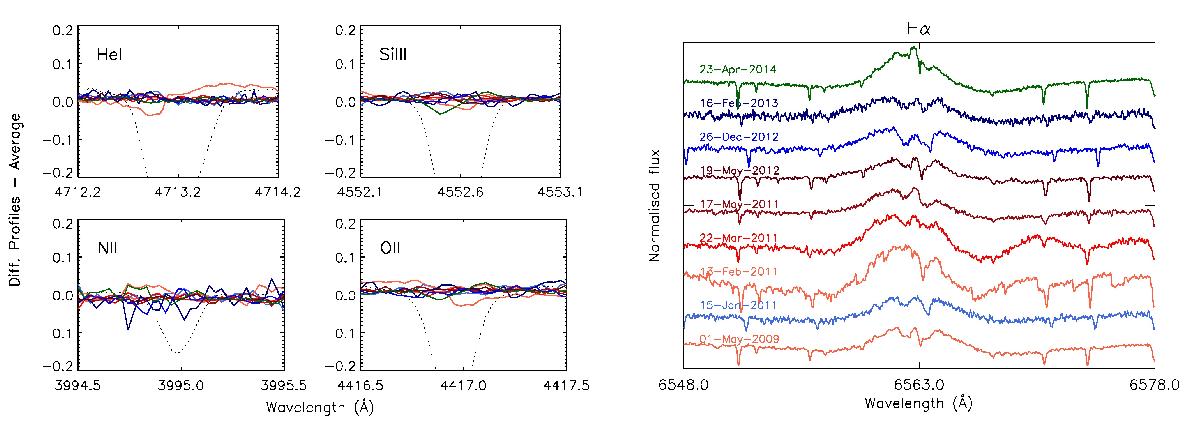
Left panels: difference for four lines between the average profile and all the observations presented in Table 4. The colour code is indicated in the right panel. The average profiles are overplotted (black dotted line). Right panel: time series of Hα profile between 2009 and 2014. The narrow absorption transitions correspond to telluric features.
Current usage metrics show cumulative count of Article Views (full-text article views including HTML views, PDF and ePub downloads, according to the available data) and Abstracts Views on Vision4Press platform.
Data correspond to usage on the plateform after 2015. The current usage metrics is available 48-96 hours after online publication and is updated daily on week days.
Initial download of the metrics may take a while.