Free Access
Fig. 5
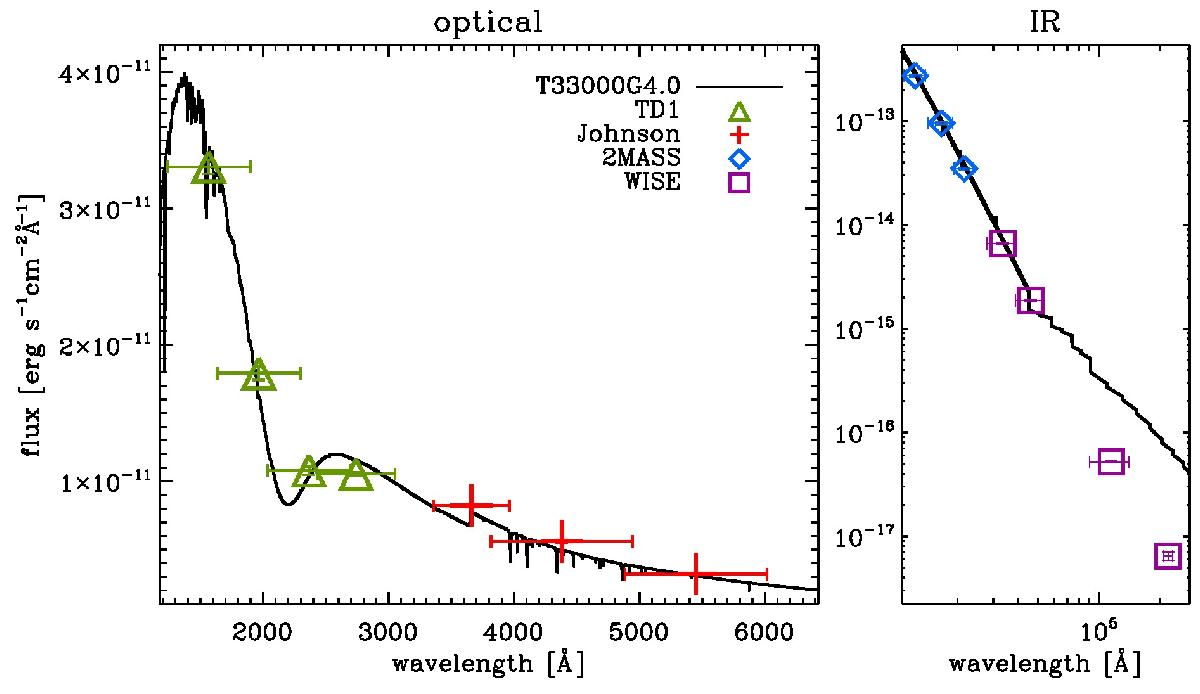
Comparison between fastwind (full black line) synthetic flux and TD1 (green triangles), Johnson (red pluses), 2MASS (blue diamonds), and WISE (purple squares) photometry converted into physical units. The UV and optical spectral regions are shown in the left panel and the IR band in the right panel.
Current usage metrics show cumulative count of Article Views (full-text article views including HTML views, PDF and ePub downloads, according to the available data) and Abstracts Views on Vision4Press platform.
Data correspond to usage on the plateform after 2015. The current usage metrics is available 48-96 hours after online publication and is updated daily on week days.
Initial download of the metrics may take a while.