Free Access
Fig. 1
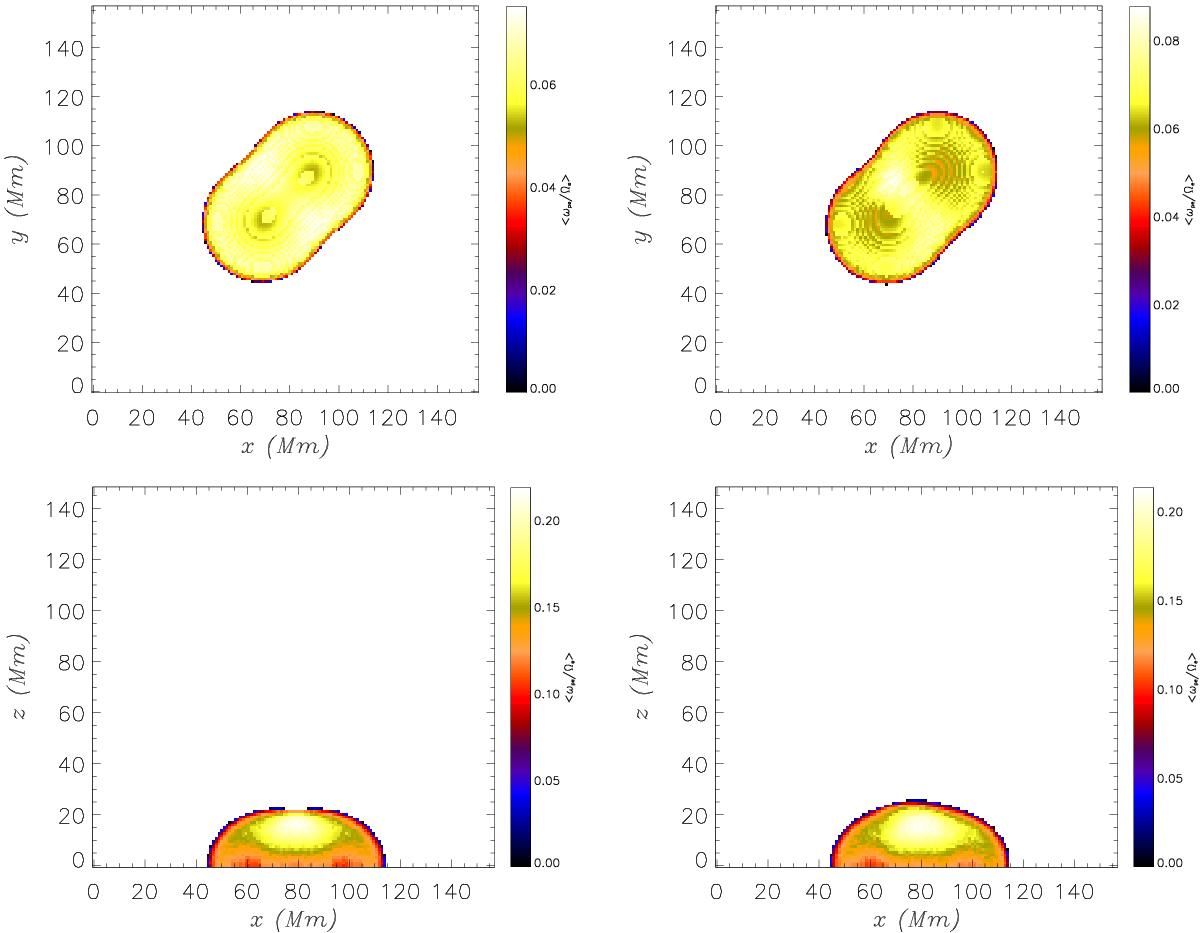
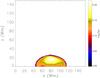
Spatial distribution of Ξe ≤ 1 for the bipolar field. (top row) top view; (bottom row) side view for the potential (left) and nlff (right) magnetic fields with varying gravity. The values of Ξe are averaged along the 3rd dimension. Only the Ξe ≤ 1 values are colour-coded.
This figure is made of several images, please see below:
Current usage metrics show cumulative count of Article Views (full-text article views including HTML views, PDF and ePub downloads, according to the available data) and Abstracts Views on Vision4Press platform.
Data correspond to usage on the plateform after 2015. The current usage metrics is available 48-96 hours after online publication and is updated daily on week days.
Initial download of the metrics may take a while.