Fig. 7
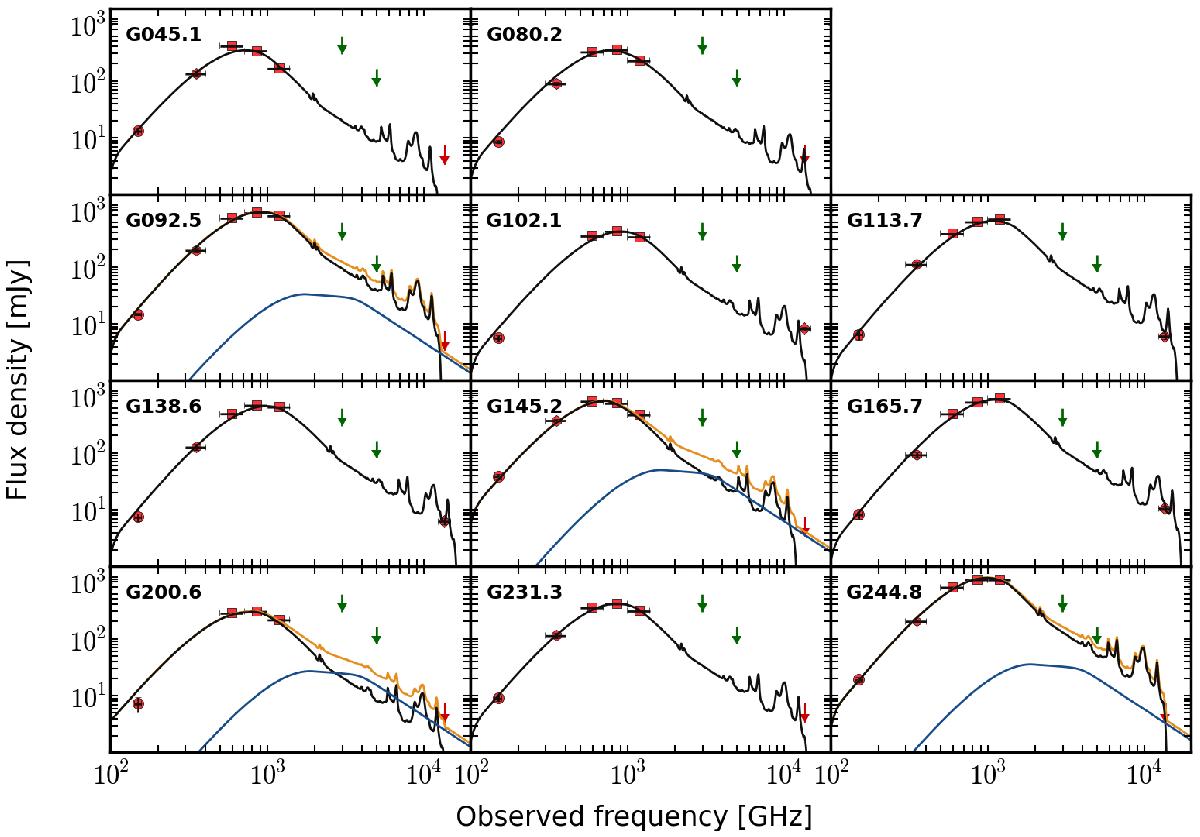
Infrared-to-millimetre SEDs of all of our 11 sources obtained using DecompIR (Mullaney et al. 2011). Red dots show our data points, where the error bars along the abscissa indicate the width of each band. The error bars along the ordinate are often smaller than the symbol size. Green downward arrows show the 90% completeness limit of the IRAS all-sky survey at 60 and 100 μm, respectively. Red downward arrows at 22 μm show the 5σ upper limits provided by the WISE catalogs, where the counterparts were fainter than the 5.4 mJy flux limit of the WISE catalog. Black, blue, and yellow lines show the starburst and AGN component (if an AGN was fitted), and the sum of both, respectively.
Current usage metrics show cumulative count of Article Views (full-text article views including HTML views, PDF and ePub downloads, according to the available data) and Abstracts Views on Vision4Press platform.
Data correspond to usage on the plateform after 2015. The current usage metrics is available 48-96 hours after online publication and is updated daily on week days.
Initial download of the metrics may take a while.