Fig. 1
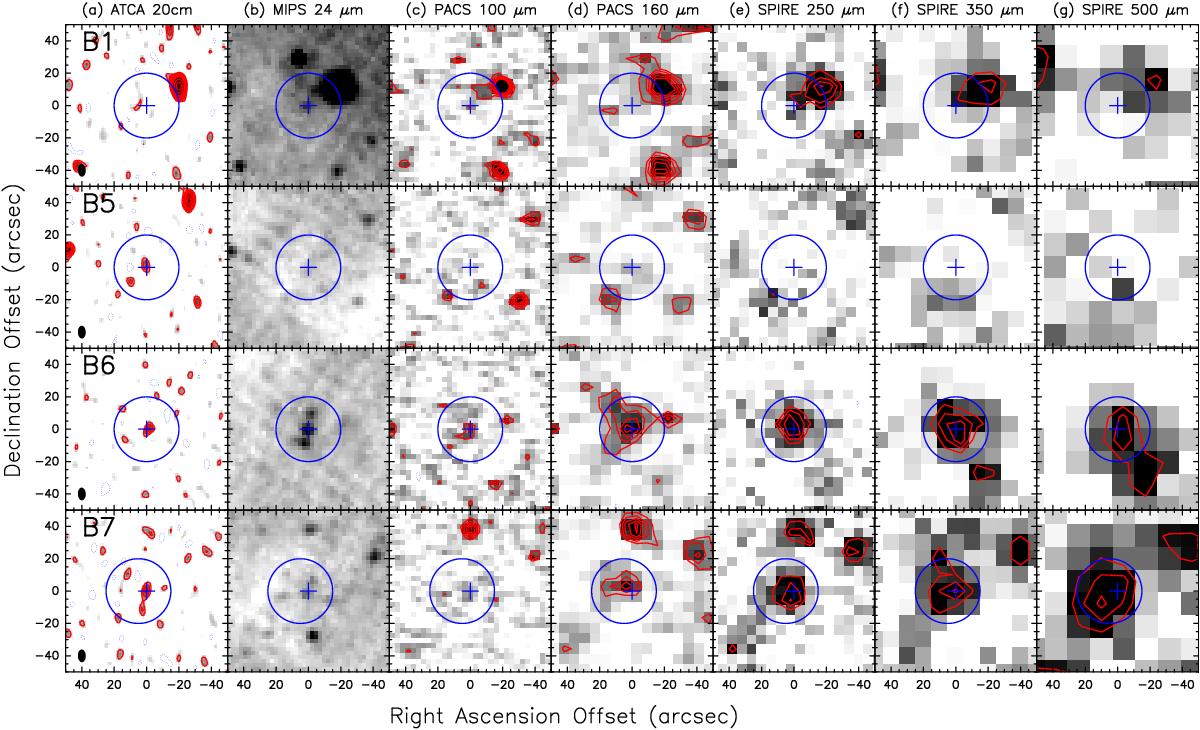
ATCA 20 cm, Spitzer MIPS 24 μm, and Herschel PACS and SPIRE data for the four Lyα blobs (LABs) in J2143-4423. a) Contours and gray scale maps of ATCA radio emission. The contours are −2, 2, 3, 4, 5, and 6 × 15μJy (1σ), with a synthesized beam of 7.8″ × 4.8″, which is shown in the lower left corner of each panel. b) Gray maps of Spitzer MIPS 24 μm emission (Colbert et al. 2006). c)–g) Contours and gray scale maps of Herschel FIR emission. The contours are −2σ, 2σ, 3σ, 4σ, 5σ, and 6σ (see Sect. 2.2 for the noise level of each band). A circle with a diameter of 40″ is shown in each panel. The circles in B7 are in an off-center position (5″, 0″) to cover the most FIR emission. All sources are centered on the positions of the four LABs (see Colbert et al. 2006) as shown with plus signs in each panel. All offsets are relative to the positions of the LABs.
Current usage metrics show cumulative count of Article Views (full-text article views including HTML views, PDF and ePub downloads, according to the available data) and Abstracts Views on Vision4Press platform.
Data correspond to usage on the plateform after 2015. The current usage metrics is available 48-96 hours after online publication and is updated daily on week days.
Initial download of the metrics may take a while.